Menu
Anyone can become a seller and there is no sign up cost. List your resources today and start making extra cash!
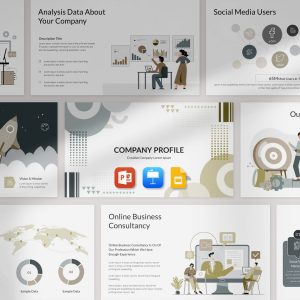
Learn moreWith so many tools available, the choice comes down to price and appearance. Looker Studio has a leg up on both. It’s free, and you can customize the design to fit your preferences.
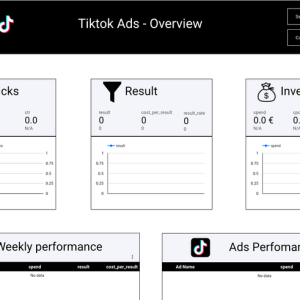
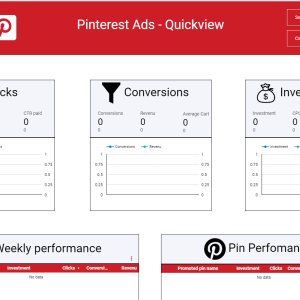
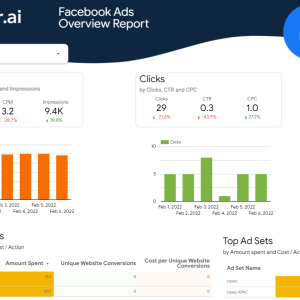
You should track anything related to ad spend. How much are you spending per month? How many impressions, clicks, and leads is it buying you? And most importantly, are you seeing an ROI on your ad spend?
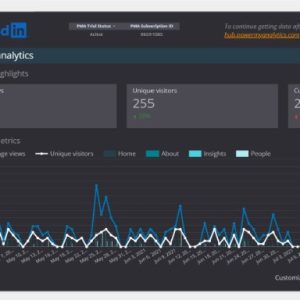
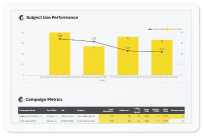
Social media is an area of marketing that can require a lot of time and investment, and that’s including paid and traditional social marketing. Tracking metrics helps you quantify your time and investment. Additionally, you’ll only improve your marketing if you analyze the data.
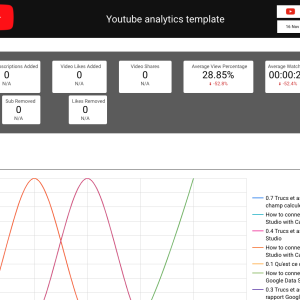
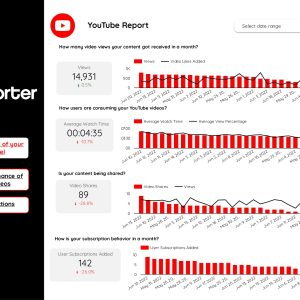
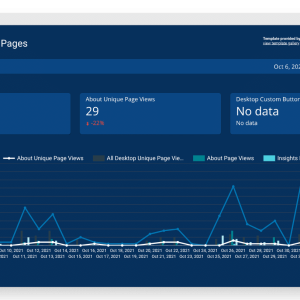
Google provides a free connector to YouTube. When you sign into your channel from the data connector, it links to your channel and let’s you pull in stats about views, likes, watch time, and more. You can use the YouTube data in all of Looker Studio’s available charts and tables.
If you don’t want to use Supermetrics, PMA, or another third-party connector, the next best option is to manually export data to Google Sheets and then connect Looker Studio to that sheet. Many of our templates are built around this idea and come with detailed instructions.
The real answer is as often as you’d like, but for most use-cases, analyzing monthly is sufficient. If you’re increasing your spend or have shorter campaign run-times, analyze more often.
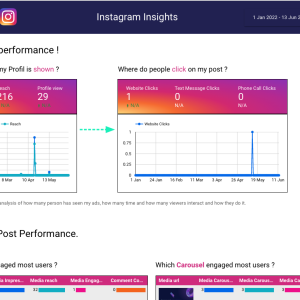
Why not both? In truth, they measure two very different things. Your unpaid social data, things like likes, comments, followers, post-performance, etc., while important, don’t have the same monetary investment as a paid promotion. Start with paid as that’s where most of the campaigns live.

Facebook might be getting old but it’s still the...

Ecommerce sales are going to hit $8.1 trillion —...

With over 1 billion active users, there’s a ton...

In this article we show you how to connect...

Digital marketers love Google Looker Studio. It has become...

Facebook Ads are one of the most commonly used...