Do you wonder why you spend so much time in email? How many emails you send a day? When you send and receive the most emails? Now you can find the answers to these questions & more with this simple gmail analysis dashboard, built with Google Data Studio. We will show you what you get in the report & how to set it up and start analysing your own email productivity today.
Setup time is around 20 to 30 minutes. It does not require any coding skills. If you’ve used email, spreadsheets & Data Studio you already know enough to get going. Once setup, your dashboard will run and refresh automatically!
What’s included in the Data Studio Email Analysis report?
The Email Analysis dashboard allows you to see the following reports:
Total emails sent vs received over a given period (see example in the screenshot below)
The quantity of emails sent vs received at different hours of the day
The quantity of emails sent vs received on every day of the week
Who are the people you send the most emails to and receive the most emails from
Email threads with the largest number of emails in them
Percentage of priority emails and starred emails that you receive
Other features coming soon in v2
Why use a Data Studio dashboard for Email Analytics?
There are tools already on the market that connect to your Gmail analyze it, so why reinvent the wheel?
We have two reasons for doing this:
Email has extremely sensitive information in it. If you use Gmail, Google already has access to your email, which means implicitly you have a level of trust in Google. GDS is another product in the Google ecosystem, so there is no further leakage of information. There is no need to provide access to another 3rd party to your data.
GDS dashboards also provides a level of customisation and shareability that other tools do not. GDS is the best dashboarding tool on the market, so we’ve taken advantage of these features as well.
Setup Overview
The basic process to setup the dashboard is covered in 5 steps:
Create labels in Gmail
Import Gmail metadata to Google sheets with the provided script
Copy our premade GDS Dashboard, Connect to Google Sheets & create new fields.
Add time dimensions back in
Create filters in GDS
This only needs to be setup one time and then the dashboard will automatically update with no further effort.
Step 1: Add label to emails in Gmail
Before we can import emails into Google Sheets. We need to prepare your Gmail account. We will only import emails that have a label on them. This allows us to select certain emails and also keep track of which emails have already been imported.
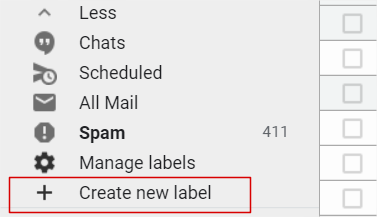
1.1) Create a new label in gmail called ‘Email Analysis’. Do this by scrolling to the bottom of the existing labels in the left menu bar and select ‘create new’
Give the label the name ‘Email Analysis’
1.2) After creating the label, select all the emails that you want to import to Google Sheets, by adding this label to them. You can do this by going to your ‘All Mail’ folder, & ticking the checkbox next to each email, then selecting the ‘label as’ button and adding them. I would suggest adding all emails.
1.3) We’ve now added all existing emails to this label. If you want to add all new emails that come in, in the future, we can setup a filter to automatically label them. We do this in gmail by going to settings >> filters and import >> create a new filter
Then create a filter using a wildcard to apply to all emails
Which then applies our label
Step 2: Import Gmail metadata to Google Sheets with script
2.1) We begin step 2 by opening a new Google sheet & naming it.
2.2) Once in the sheet open Tools >> Script editor
2.3) Within the script editor clear all the existing text/code, and instead paste the below script in:
function pullEmailData() {
var ss = SpreadsheetApp.getActiveSheet();
var label = GmailApp.getUserLabelByName(“Email Analysis”);
var threads = label.getThreads();
for (var i = 0; i < threads.length; i++)
{var messages = threads[i].getMessages();
for (var j = 0; j < messages.length; j++)
{var to = messages[j].getTo();
var from = messages[j].getFrom();
var sub = messages[j].getSubject();
var date = messages[j].getDate();
var important = messages[j].isInPriorityInbox();
var starred = messages[j].isStarred();
ss.appendRow([to, from, sub, date, important, starred]);}
threads[i].removeLabel(label);}}
Save the script and click run.
It will ask to provide permissions & it will also issue a warning that it is not a trusted source. You should click the advanced link below and click proceed in order to make it run. After the script begins to run you will start to see data populate in Google sheets.
The script will run for 6 minutes before timing out. It will likely not pull all of your email data in within that time. You can run it again, but if you run it too often it might get blocked. Note that every time the script runs & imports a specific email, it will remove the label we added in step 1 from the email in gmail so that the next time it runs it will only add in emails to the sheet that still contain the label.
2.4) After the script has finished, we need to add in column headers. Please create a new row in row 1 above existing data, with headings as follows:
‘To’, ‘From’, ‘Subject’, ‘Date & Time’, ‘Priority Inbox’, ‘Starred’.
This should look as follows:
2.5) After running the script at least once, you now should have a few hundred emails at least, imported into the sheet. We recommend setting up a schedule in the script which automatically runs the script once a day to ensure new emails are continually imported. We can do this by creating a trigger in the script editor
The select + add trigger in the bottom right corner.
Change the settings to be ‘Time-driven’ and make it a ‘day timer’, then click save.
Step 3: Copy Data Studio Template, connect source & create new fields
The hard work in setting up the template has already been done for you. The template is created and ready to go, we just need to make a few small tweaks to connect it to your data source.
3.1) Open the email analysis template.
3.2) Copy the template, there is a button in the top right corner:
In the next pop-up screen, open the drop-down under ‘new data source’ and select ‘Create New Data Source’
From the list of sources present, select Google Sheets, and then find the correct sheet that you created in step 2.1 and click “Connect” in the top right:
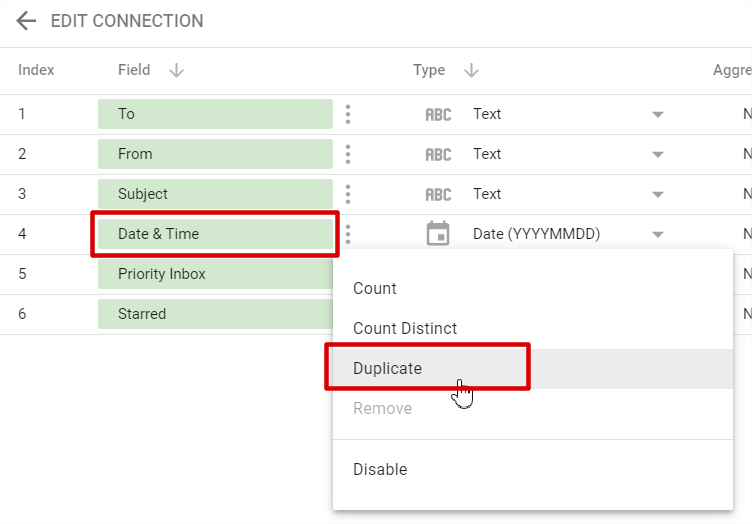
3.3) After selecting the correct sheet, we now need to create 3 new fields
On the three dots next to the ‘date & time field’ select ‘duplicate:
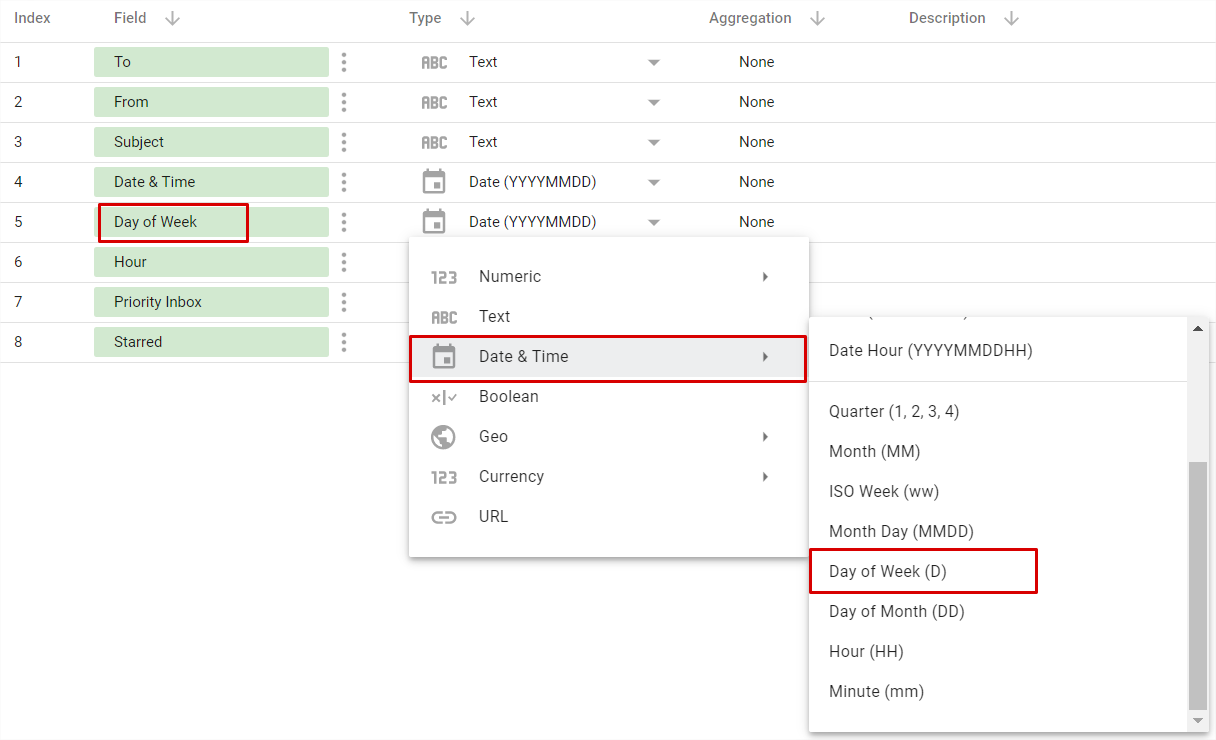
You will now have a new duplicate field which we will rename ‘Hour’. We update the ‘type’ settings for this field to Hour, as follows:
Step 3.4) we do the same for ‘day of week’. Again duplicating the date & time field, renaming it and changing it’s ‘type’:
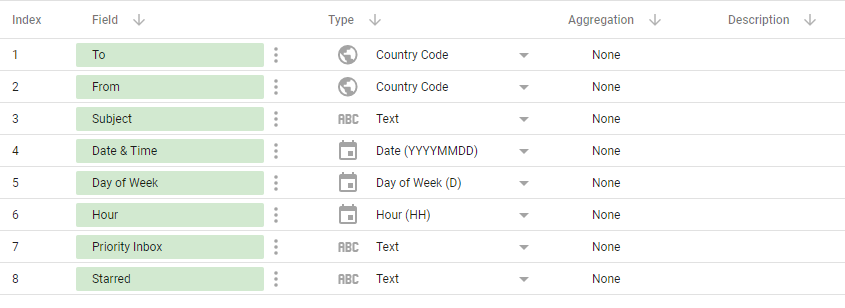
Finally the connections should look as follows:
3.5) Once you have added these fields. Select “Add to Report” to confirm the data connection and then click “Copy Report” to be taken to your own version of the Email Analysis dashboard with your data connected.
Step 4: Move time dimensions back in.
We now have our dashboard almost ready to go. At this stage you might notice that some of the graphs are broken. We need to update the fields in some of the graphs. Please refer to the screenshot below for graph number.
Graph 1 & 2 should be working out of the box.
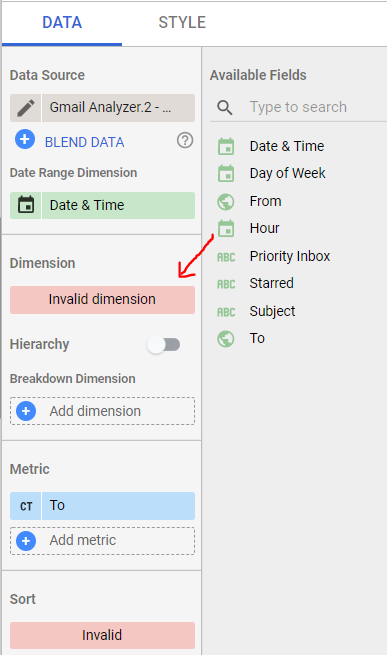
<4.1) For both graph 3 & 4, select them one at a time and select the ‘data’ tab in the right hand menu, then drag the ‘Hour’ dimension into the ‘dimension’ slot. (the sort field will auto update).
4.2) for graphs 5 & 6, select each on individually and drag the ‘day of Week’ dimension into the ‘Dimension’ slot
Step 5: Update filters
You’ll notice that in the To & From columns in the data sheet we have emails not just addressed to you and sent from you. (this is because each email has both a To & From entry). We only want to analyse emails that you received and emails that you sent. The filters are already created, you just need to update your email address.
Filter 1. To & From your own email only
5.1) Within the template, under resources, select ‘Manage FIlters’.
You will then see a screen which has 3 filters in it. First select the ‘From Me’ filter and click ‘Edit’.
Then update the email address within the filter
Note that if you have multiple email addresses or email aliases that you are using in one inbox you can add them using an ‘OR’ statement.
Then save
4.2) We also do the same for the 2nd filter for ‘To Me’. and then save
Troubleshooting Common Issues
All graphs and filters should now be working provided you followed the above instructions. If for some reason any of your graphs or filters are still not working, try the following:
Double check your column headers in your Google Sheet are spelt correctly – If these are different, they will not work.
Check there is email data in your Google Spreadsheet
Check your Data Source Connection in GDS – Make sure the ‘Day of Week’ and ‘Hour’ fields are correctly set up as per above.
Starting your Analysis
The dashboard is now ready to go. You’ll noticed there are five filters at the top. Each filter will adjust all the graphs in the table.
Date: The first filter is the date range, it includes emails that fall in it’s date range based on when the email was sent or received
From: The second filter is ‘From’ this allows you to view information based on specific senders of email to you. (or exclude specific senders)
To: The opposite of ‘From’, allows you to view information just for specific recipients of your emails
‘Priority Inbox’ & ‘Starred’: The third & fourth allow you to view only priority or starred emails, so that you can drill down into your most important emails.
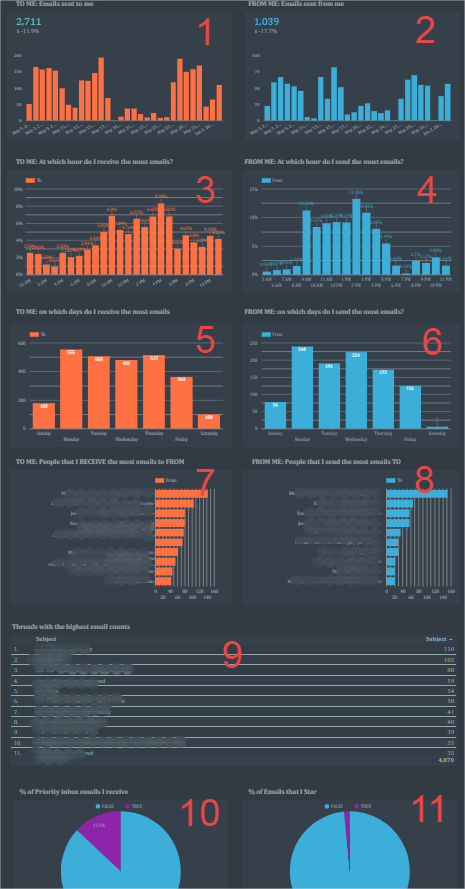
The following is a breakdown of all the graphs included. Please refer to the screenshot above where each graph is labeled with a different number
Graphs 1 & 2: show all email sent To me & From me.
Graphs 3 & 4: same as above, but aggregated per hour. This allows me to see when are the busiest hours of my week
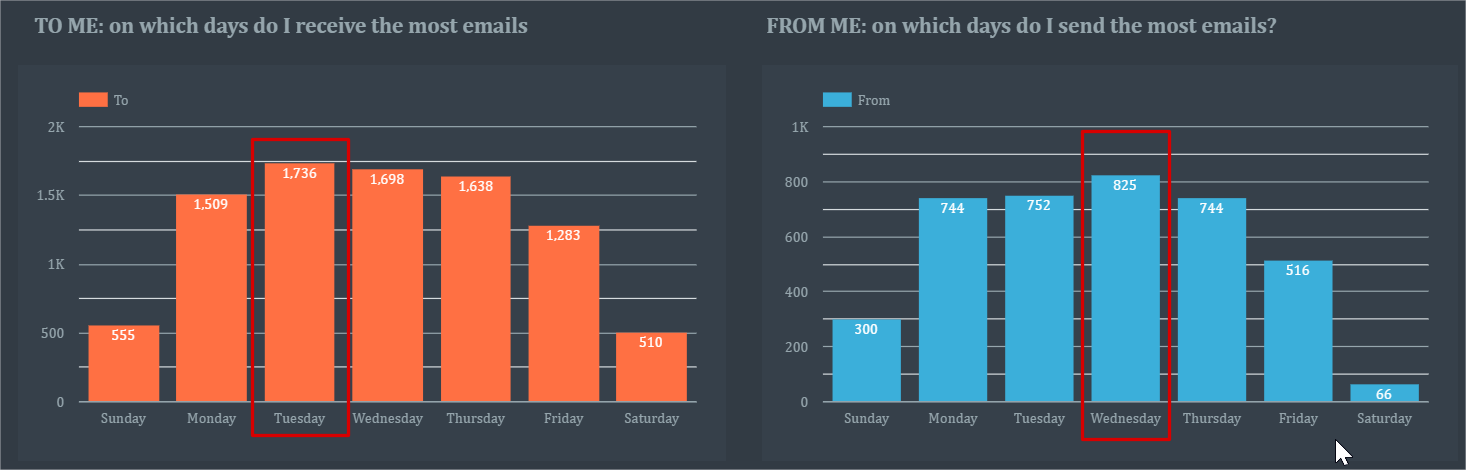
Graphs 5 & 6: same as above, but aggregated per day. This allows me to see which are the busiest days.
Graphs 6 & 7: show people that I received the most emails from and send the most emails to.
Graph 8: shows email threads with the most emails in it. Displaying which conversations are the most in depth.
Graph 9: shows the percentage of all emails that end up in my priority inbox
Graph 10 shows the percentage of emails that I end up starring in my inbox.
Interesting findings from our data
After setting up the dashboard and importing 4 months worth of emails we are already seeing very interesting trends. Here are some of our findings so far:
People tend to send me the most emails at 10am in the morning and then again at 4pm. This is probably because they are getting into the office doing what they have to do in the morning and then firing off work to be done. Similarly at 4pm, they are probably emailing me things that need to be done before they have to leave for the day.
I send out the most emails at 10am and 11am. This correlates with what I receive. Which means I fit this pattern and I am also responding to a lot of these emails (or maybe my recipients are responding to me!). There is also an evening bump, which shows that I am sitting down to do more work from 8pm to 11pm, not great for my work/life balance!
I’ve also noticed that Mondays & Fridays are relatively quiet in terms of receiving emails. However, I send a lot of emails myself on Monday. I like to think I am more productive then others on a Monday!
Tuesdays is when it gets crazy. In line with this, I send the most emails on Wednesday, which is likely a response to these busy Tuesdays.
The rests of the insights are more personal, but I encourage you to look at who sends you the most emails in graph 7 and then filter the whole report from that sender (in the top filters). It’s interesting to see when that person is sending and when you respond to him or her.
What’s Planned Next?
There are a few more things we could add to this dashboard, which we will work on for version 2.0 if there is enough interest.
Importing email body content in order to analyse the length of emails & possibly sentiment. We can then review whether we send or receive longer emails & the sentiment of sent & received emails..
Include/exclude Spam emails
Understand time delay in receiving and sending emails
Analysis for gchat/hangouts as well as emails.
Add analysis for other people within the company. Understand average performance per staff member and specific performances.