Menu


When it comes to email analytics, looking at a single campaign is helpful, but so is a high level view of all your email data. How are open rates across the board? Which subject lines performed best? Is traffic coming back to your website, or is no one clicking? You can only know this if you have a single view of all your data.
That’s one reason to use Google Data Studio. When you connect your email data, specifically in this example from MailChimp, you’ll have that top level view to analyze the totality of your marketing campaigns from automations to single deployments. In this guide, we’ll show you how to generate a report, upload it to Google Sheets, and finally pull it into Data Studio, all for free (Meaning, there is no need to pay ongoing for a 3rd party connector service).
Note that there are paid connectors to Data Studio from companies like Supermetrics or Power My Analytics. The benefit here is that your data connects automatically, so any new email campaign will appear in your dashboard. The downside is it costs around $30 a month or more. However, if you’re going to pull data on an ongoing basis, you may want to pay for the convenience.
In the last step of this guide, we’ll talk about preparing your data specifically for this MailChimp Dashboard, available on our webstore. It has all the charts and design you’ll need, all it requires is your exported data. Here we go.
Check out our Mailchimp Data Studio Dashboard here.
Sign into your MailChimp account and navigate to the campaigns tab. It’s the icon that looks like a megaphone. Once you’re there, select “Reports” from the menu.
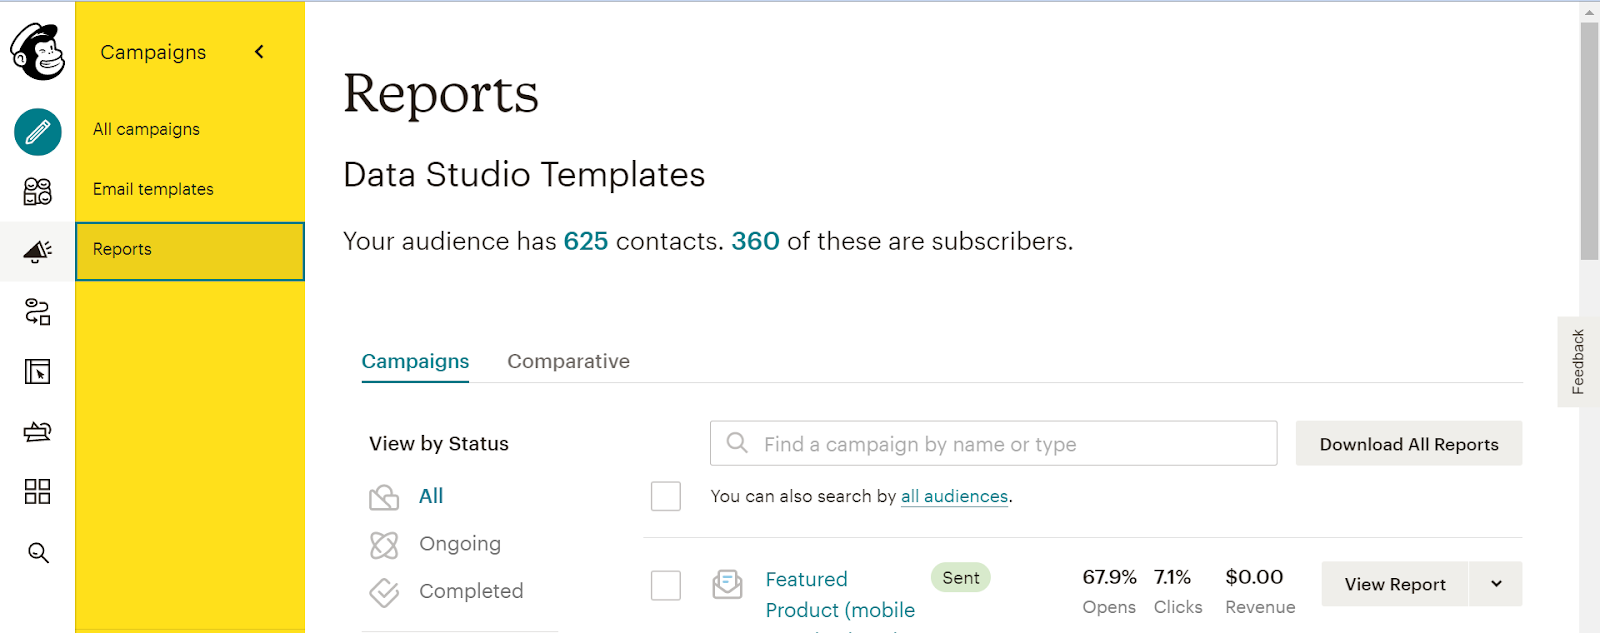
While you can view an individual report for a single campaign or send, we want to download all the reports. Later, however, instead of downloading every report again, you could download a single report and add it to your spreadsheet. Click on “Download All Reports” and generate the report.
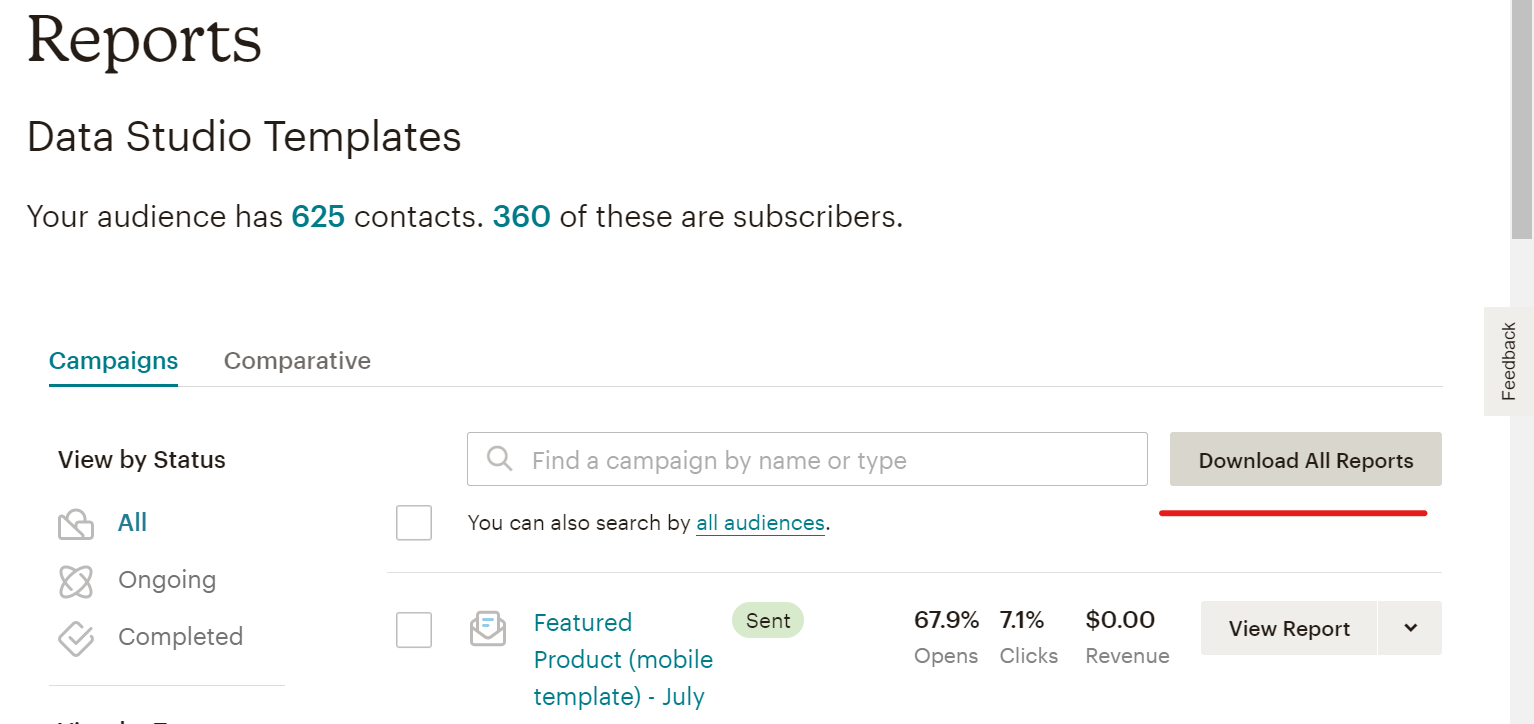
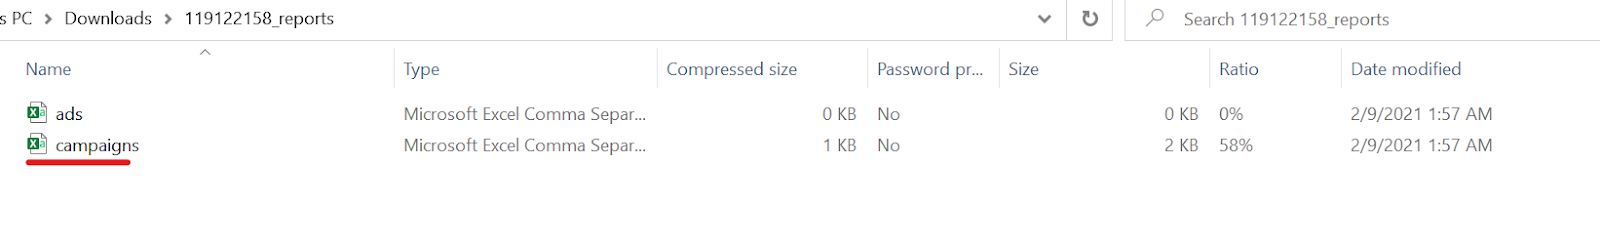
It takes a few minutes for MailChimp to finish. Either stay on that page, or wait for an email which tells you the report is ready, then download the file. The report will download in a zip folder. Open it up, and choose the “campaigns” excel file.
Now it’s time to place the data into Google Sheets so you can use it in Data Studio. It’s most simple to copy the data in the spreadsheet and paste it into a new Google Sheet. Or, follow these steps to convert your Excel Sheet into a Google Sheet.
First, open Google Drive and click “New File Upload.” After it’s loaded, click on the file. This will open the document in Google Drive, though it’s not yet a Google Sheet. Click File, then “Save as Google Sheet” to convert your document. Don’t forget to give the sheet a new name.
There are a few things you can do to the spreadsheet to help make the data more legible. For instance, some of the metric names on Row 1 are a little funky. We suggest you change “Title” to “Campaign Name” in Column A, “Successful Delivery” to “Delivered” in Column D. Feel free to change others that may make it easier to interpret your data. If there are campaigns you don’t want to include, make sure you delete those rows and the white space between rows.
Go to Google Data Studio and open a blank report. Then, choose Google Sheets from the list of free data connectors and select your spreadsheet, which should be at the top. Otherwise, use the search bar to find it. If it doesn’t show up, just fresh the screen and look again.
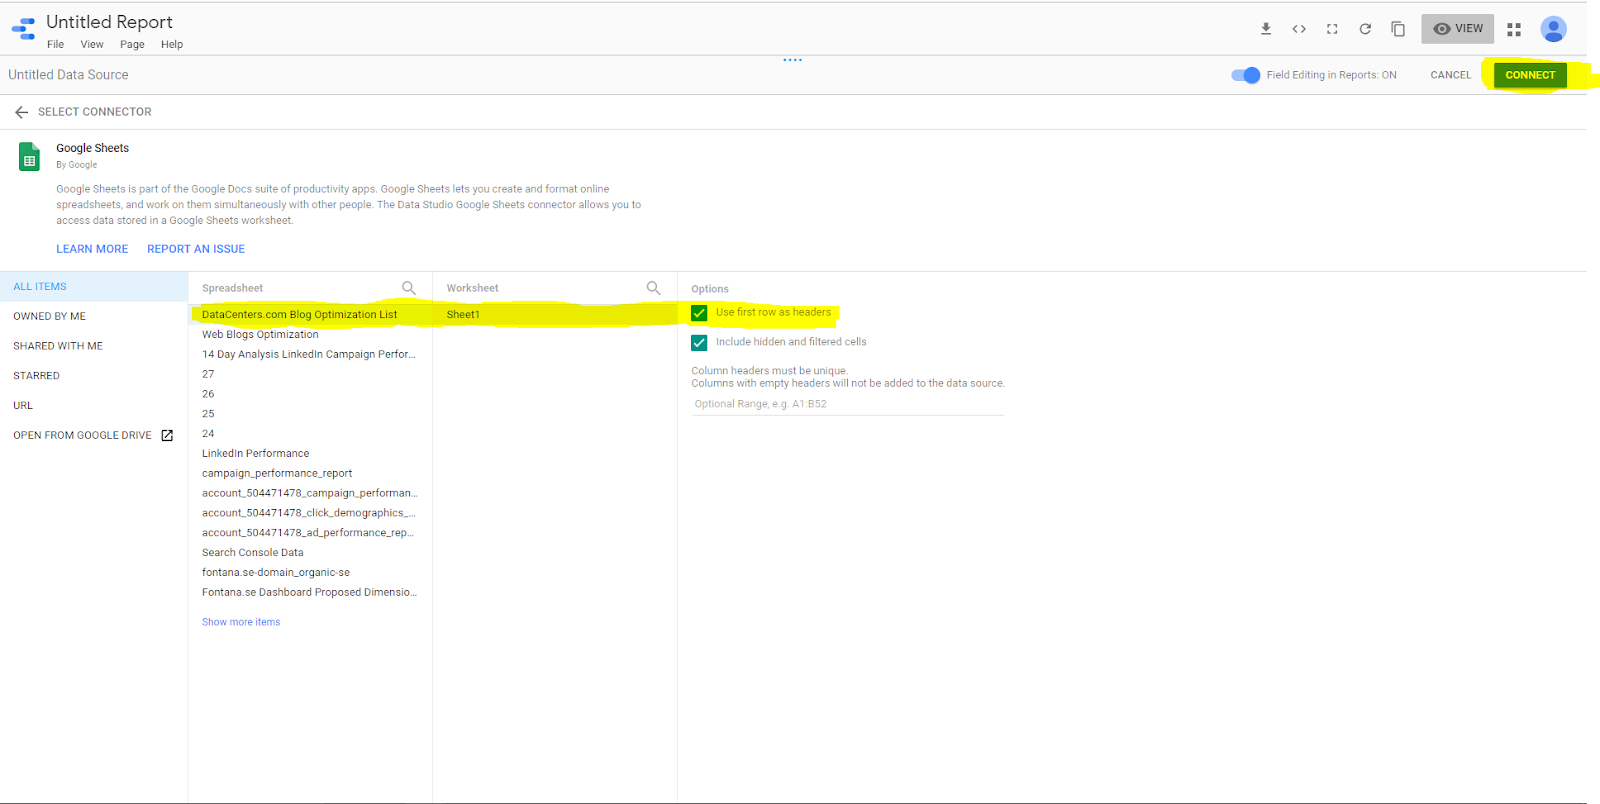
Your sheet should be at the top of the list!
Just as we changed some metric names in the Google Sheet, we need to change some aggregations in Data Studio. This just means that the dashboard has misinterpreted the type of data, say assuming something was a number instead of text, and we need to fix it before we use it on a dashboard. Here’s what you need to change:
A quick note on those last metrics, “Pages/Visit” and “Visits.” These will only contain data if your MailChimp profile is attached to your Google Analytics account. We recommend this as it’s a quick way to see email acquisition to your site, and the impact from specific campaigns. Here’s a guide to help.
Here’s where we get specific about the MailChimp template and some of the data you’ll find in the “Campaign” report. As you’d expect, this dashboard has a funnel and some high level statistics about your campaigns. The heatmap table will help you see outliers and performance quickly. We’ve also included a table with stats about your website acquisition, broken out by campaign. Another chart looks at your subject line performance with an additional metric for length to help you understand whether a short or a long subject line performs best.
As mentioned before, when you have new data to add to your spreadsheet, you can simply download a single report from MailChimp. Or, if you want to download the whole thing monthly, quarterly, or annually, that works as well. Just copy and paste the new data into your Google Sheet to maintain the same metric headers in Row 1.

