Menu

Marketing reports are more than just numbers on a page – they help us process and highlight information. They communicate the success of a strategy and show value.
Well-designed reports pull numbers from spreadsheets to tell the story of your strategy’s success, point out areas for improvement, and guide future decision-making. Report design is for much more than just appeal; it influences how important information is understood, valued and remembered by your client and team.
Humans have been telling stories since we sat around fires in caves, using them to make sense of life’s complexities. Stories hold power because they resonate with how our minds naturally process experiences, arranging them into narratives that reveal struggles, growth, and resolution.
By using storytelling in your marketing reports instead of traditional data-heavy formats, you make the content more memorable and, resultantly, impactful. Each report you share with a client is just one chapter in your time together – a tool to update them on the progress toward your shared goals.
When you present data as part of a compelling narrative, like a client’s journey from challenge to success, you connect the story to their goals, bringing the numbers to life. This approach not only explains the results you’ve achieved but also helps the client see where the current report fits into the bigger picture of long-term progress. By weaving facts into a narrative, you transform abstract data into a vivid, relatable story that stirs emotions and inspires action, even if the results aren’t always instant or perfectly positive.
A great example of storytelling at work is Charity Water. Charity Water is one of the world’s most famous nonprofits and is best known for its storytelling abilities. Its video, The Spring, has over 34 million views on YouTube and Scott Harrison is known for attributing their success to their ability to tell stories that inspire.
Instead of trying to educate donors on the importance of water, Charity Water and Scott have tried to inspire them by telling stories of real people who have real problems and need real help. In the process, they educate their donors on the global water crisis.

Don’t underestimate how important storytelling is for communicating value with clients. It doesn’t matter if you have done a good job or if there are events that were out of your control. To build a lasting and effective relationship with a client, they need to understand why you are doing what you are doing and agree on the direction you are taking together. This will also help with building enthusiasm amongst the team regarding the chosen direction.
Creating this with pages of boring information is unlikely. But using storytelling techniques to inspire… that’s where the magic happens!
Purchasing a ready-made report template can help you streamline your process without investing excessive time in design and formatting. Pre-made templates come with professional layouts, built-in features, and industry-specific insights, saving you hours, if not days, of work. Because experts design templates, they are structured to highlight the most critical data for clients or stakeholders.
When considering buying a report template, assess its adaptability to your unique needs. Beyond looking great, it should genuinely enhance your reporting process. For a deeper look at whether buying or building is best for your business, read our guide: Marketing Resources: Buy vs. Build – What’s the Best Approach?
Design plays a crucial role in transforming raw data into a story that’s engaging and easy to digest. Regardless of industry, the design of reports matters.
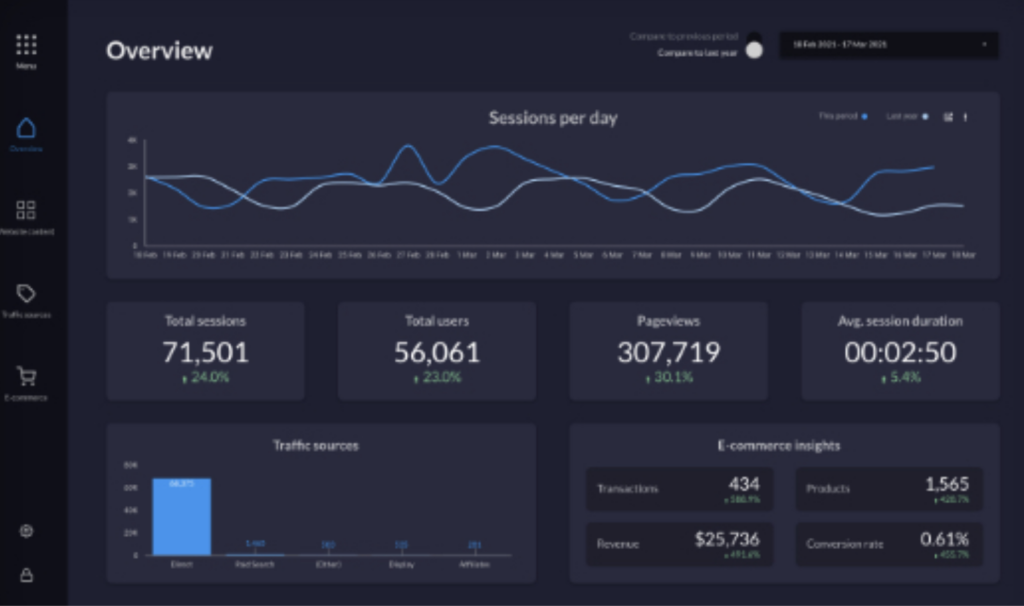
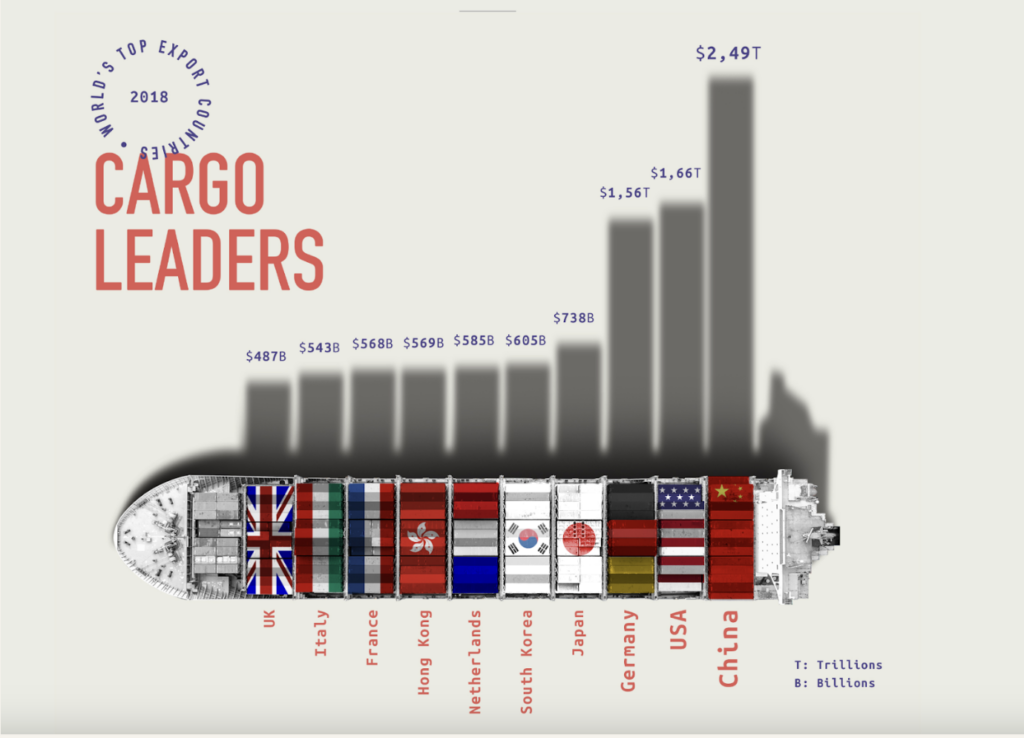
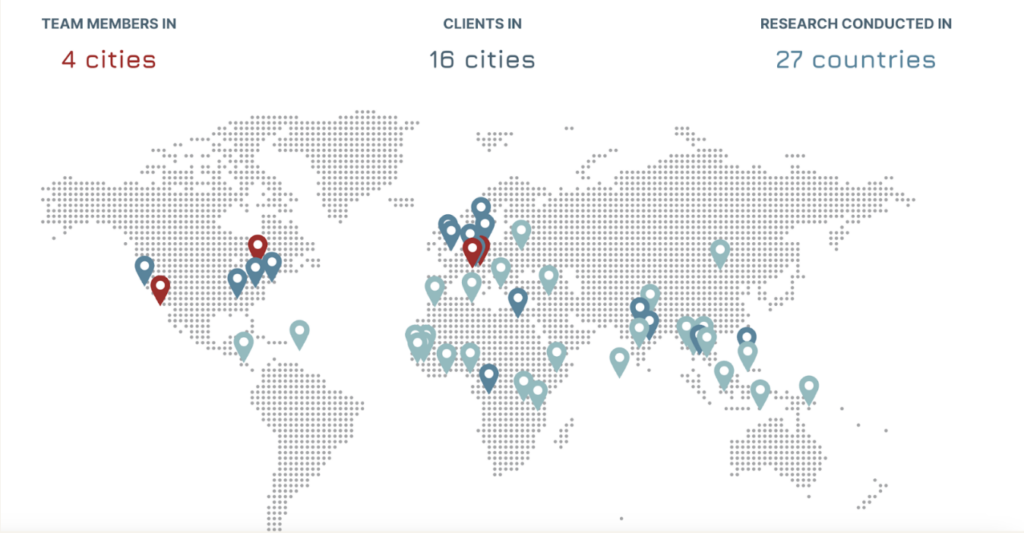
A well-designed marketing report isn’t just visually appealing; it makes complex information accessible, memorable, and impactful. When you use design elements like infographics, colour schemes, and clear layout structures, you help guide the reader’s focus and highlight key insights without overwhelming them. This approach taps into visual storytelling, allowing clients or stakeholders to better grasp the impact of your work, identify trends, and make informed decisions.
Integrating visuals like charts, graphs, and colour-coded indicators can reduce cognitive load and enhance the retention of important details. For instance, using a clean, intuitive layout with clear headings, balanced whitespace, and minimal but effective icons ensures that readers are not just glancing at numbers but truly understanding them. Research shows that combining text with visuals improves comprehension and increases the likelihood that information will be remembered.


A great report isn’t a one-time effort – it should evolve to meet the needs of your clients. Regularly asking for client feedback helps you understand what’s working, where they have questions, and what could be clearer. By addressing small suggestions consistently, you’re building a stronger report over time. These small, steady improvements compound, creating a more effective and polished report that better communicates your data and strategy. Plus, each client’s feedback helps you refine all your reports, making them more engaging and valuable for everyone.
Make sure to have a clear strategy in place for getting this feedback.
Research has shown that positive feedback outweighs negative feedback 4:1. Your customers may be reluctant to share negative feedback. This can be avoided by making surveys anonymous or by asking very specific questions such as, “Hey xxx, what’s one thing we can do to make our report better?” instead of “Are you satisfied with our reporting?”. When we ask more granular questions we get more specific and useful feedback.
Creating a compelling marketing report involves more than gathering data; it’s about presenting insights in a way that resonates, informs, and inspires action. By crafting a narrative, leveraging visually appealing templates, integrating design elements, and actively seeking feedback, you can transform each report into a powerful tool that showcases your strategy’s value and progress.
The right report will engage clients, making them feel part of the journey, and will foster trust as they see clear evidence of your impact.
Get a Premium GA4 Template for FREE
A marketplace to buy and sell 100’s of high quality templates, dashboards and reports from Looker Studio templates to Contracts and SOWs. Instant download and product support is what sets us apart.