Menu


With over 1 billion active users, there’s a ton of TikTok engagement data out there to be analyzed. Sure, you could use the built-in analytics tools but if you want more control over your data, Google Sheets is the way to go.
In this article you’ll learn how to connect TikTok ads to Google Sheets and start building reports.
You can also find a Tik Tok Ads template for Looker Studio here.
Although it’s easier to stick with the built-in analytics, you’ll miss out on some powerful analytics tools. Here are some of the best reasons to link TikTok with Google Sheets:
There are three ways to get your TikTok Ads data into Google Sheets:
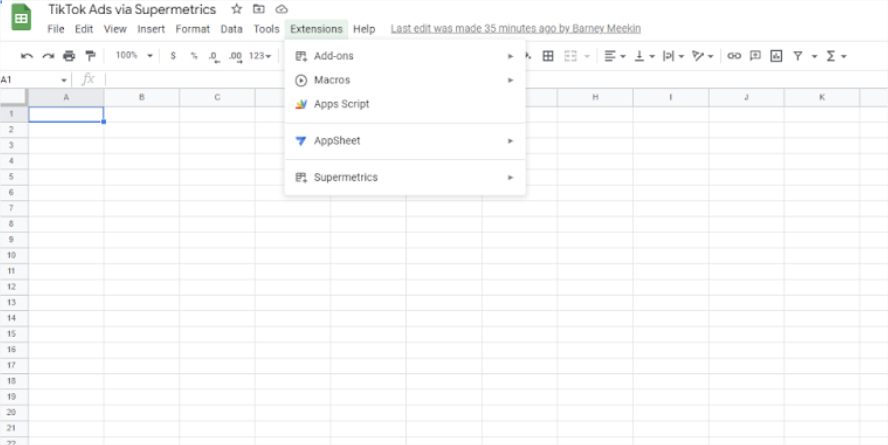
After creating — or signing in to — your Supermetrics account, you need to install the Google Sheets add-on. To do this, click ‘Extensions’ at the top of the spreadsheet. You’ll see an option for ‘Add-ons.’ Click that and then click ‘Get add-ons.’ Search for Supermetrics and install the extension. You’ll need to log into Google and give Supermetrics permission to access your Google Account before the installation can finish.
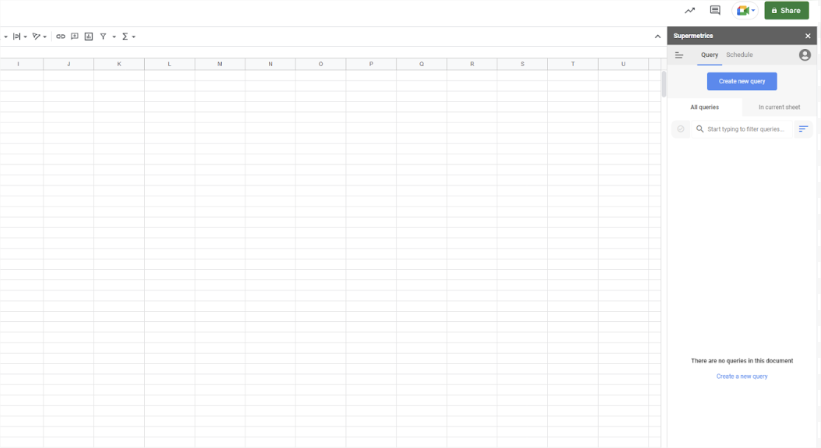
After launching the sidebar, it’ll appear on the right side of your screen. To get started, click ‘Create new query.’ Now you’ll see all of the different data sources Supermetrics connects to. For this demo, we’re using TikTok Ads. So search for TikTok Ads in the search bar and click the icon. Next, you’ll need to log into your TikTok account and give any required permissions so Supermetrics can access your data.
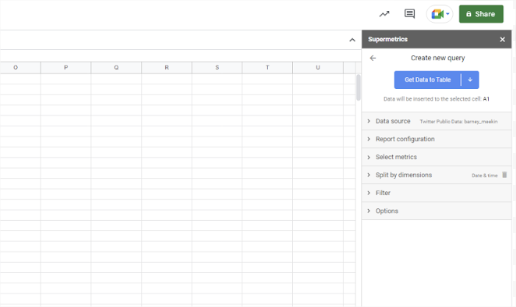
To get the data into your spreadsheet, you need to configure the query. Luckily, Supermetrics has a super easy interface. All you need to do is select the timeframe, the metrics you’d like to analyze, and the dimensions you’d like to split it by. Click the blue ‘Get data to table’ button and the transfer will start.
To make the most out of Google Sheets you can add multiple data sources and queries. You can start visualizing and comparing your data to make sure your marketing efforts are on the right track.
Google Sheets is Google’s browser-only spreadsheet. You can use it for tasks such as data analysis, budget planning, and creating charts and graphs. Because it’s integrated with the rest of Google productivity software, it’s ideal for collaboration. It can be accessed through a web browser or the Google Sheets mobile app.
Google Sheets is perfect for analyzing Tik Tok marketing metrics. Here’s why:
– Google Sheets is a free service, whereas other marketing data analysis tools can be expensive.
– It integrates with other Google tools such as Google Adwords, Google Analytics, Google My Business and more. So you can easily pull in data from these platforms and analyze it alongside other data.
– It’s customizable and flexible. You can create custom formulas and charts to meet your needs
.
– Multiple users can access and edit the same sheet at the same time. It is easy for teams to work together on data analysis tasks.
– Google Sheets is easy for people with little to no experience with data analysis tools to use
– It has many built-in options for data visualization, such as charts, graphs, and pivot tables, which can help you understand your key data like engagement metrics.
Yes! On the byMarketers marketplaces we have a full range of Google Sheets resources that can help you with your marketing. All of our templates are made by experienced digital marketers.

