Menu


Small businesses are acquiring treasure troves of data. Google Data Studio is a fantastic tool that makes it easy for small businesses to visualise this data, discover insights and make informed business decisions.
In this article I’ll show you how you can create a report to analyze the sales from your small business. You can access the finished Google Data Studio report here, it is a demo Restaurant Sales report
Setup difficulty: Medium
Reading time: 10 minutes
Quick links:
This report is intended for those who want a more efficient, visually interesting way of monitoring their sales and taking a look at the data.
Instead of static reports on PDF or Powerpoint, Data Studio allows you to send live, interactive reports to co-workers. And if you still prefer static reports, Data Studio has a built in function to save the report as a PDF, as well as to schedule email updates!
And while the sales data in this report may not be in the exact same format you use, the same principles of how to connect and display your data apply.
While Data Studio is commonly used to visualize information from connectors, such as Google Analytics and Google Search Console, there is a wide variety of information that can be displayed using the platform.
Because Data Studio is free to use, and relatively intuitive to use it is the perfect match for small business owners who may want to explore their data but don’t require (or cannot afford) complex visualization software.
In this blog post I’ll give you an example of how you can visualize sales and revenue using Google Sheets and Google Data Studio.
Google Data Studio connects with a multitude of connectors. These include products from Google’s marketing platform (Google Analytics, Google Search Console, Google Ads), YouTube Analytics, Twitter and Facebook Analytics (through third-party software) and more.
Data Studio can also connect directly to Databases, with MySQL and PostgreSQL connectors supported.
However, one of the most versatile ways of adding data to Google Data Studio is using Google Sheets.
Google Sheets allows you to add any type of data to Data Studio.
n this blog post I’ll go through a step by step process showing how you can add Sales Data to Data Studio.
I’ll use data from a hypothetical restaurant to give an example of how you can turn data into attractive, easily updated and easily shareable reports.
Here’s a link to the Google Sheet with our demo sales data.
Let’s imagine that our restaurant business lists all its sales very simply.
Our Data Source: A Basic Sale Sheet
| Date | Sales Code | Number Sold | Takeaway / Sit Down |
| 1 January 2019 | S_B_01 | 11 | takeaway |
| 1 January 2019 | S_B_02 | 1 | sit down |
| 1 January 2019 | S_B_03 | 12 | takeaway |
| 1 January 2019 | S_P_01 | 0 | takeaway |
| 1 January 2019 | S_P_02 | 6 | sit down |
They list the date, the Sales Code and the Number of Items sold. They also list whether or not the order was Takeaway or SitDown.
However, there are more details we’d like to find out about each of the items sold.
To add these details, we’ll need to create a second sheet in Google Sheets.
| Sales Code | Item | Type | Meat, Vegetarian, Vegan | Price |
| S_B_01 | Burger | Beef Burger | Meat | 10 |
| S_B_02 | Burger | Chicken Burger | Meat | 10 |
| S_B_03 | Burger | Vegan Burger | Vegan | 10 |
| S_P_01 | Pizza | Margarita Pizza | Vegetarian | 12 |
| S_P_02 | Pizza | Pepperoni Pizza | Meat | 14 |
| S_P_03 | Pizza | Tomato and Basil Pizza | Vegetarian | 14 |
| S_S_01 | Salad | Grilled Chicken Salad | Meat | 10 |
| S_S_02 | Salad | Couscous salad | Vegan | 9 |
| S_S_03 | Salad | Greek Salad | Vegetarian | 9 |
| S_D_01 | Dessert | Chocolate Cake | Vegan | 6 |
| S_D_02 | Dessert | Cheese Cake | Vegetarian | 5 |
| S_D_03 | Dessert | Ice Cream | Vegetarian | 4 |
So we have our Sales sheet, with just the basic information. And we have our list of items with more detailed information.
We could combine these two data sets in Google Data Studio, using the Blend Data function. But I prefer the method of combining the data in Google Sheets.
To do this we will use some Google Sheets formulas. If you have ever used Microsoft Excel before then some of these formulas will be familiar to you.
The function we use is VLOOKUP.
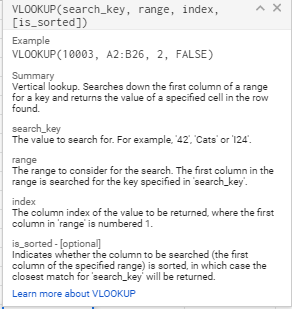
Without getting into too much detail, VLOOKUP (also known as Vertical Lookup) allows you to search another table for details that match a cell in your table.
A standard VLOOKUP formula goes like this;
=VLOOKUP(The item you’re searching for, the range of cells, the column number, whether you’re looking for an exact match or not)
We can use the VLOOKUP function as part of a formula, as shown below.
=VLOOKUP($B2,’Menu Items’!$A$1:$F$13,2,FALSE)
This formula lets us bring in information from the Menu sheet to the Sales sheet. It means that just by having the Sales Code, we can add in lots of extra information.
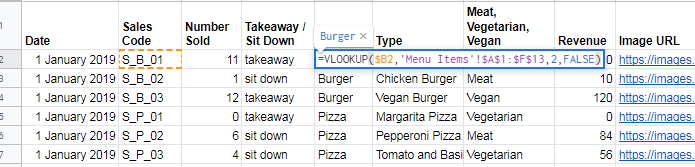
For example, we can add in what type of food it was, whether it was vegetarian or vegan, how much revenue it brought in, and add in a link to an image of the food. This will come in handy when creating the Data Studio report.
After we’ve built our data sheet, we can now move onto the fun part of creating our Data Studio report!
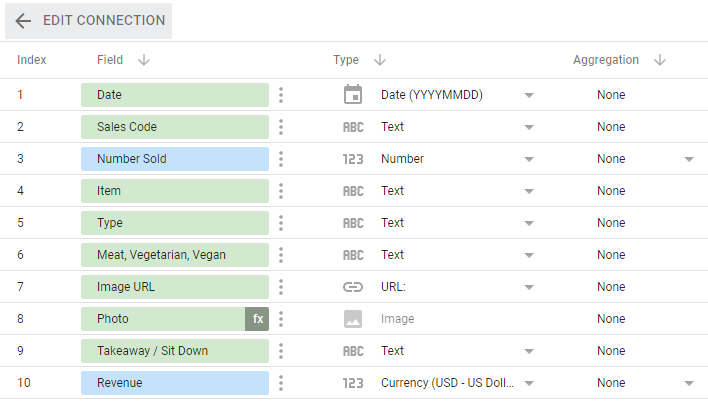
Since we used the VLOOKUP formula to bring across data to our Sales sheet, we only need to connect the Sales sheet to Data Studio.
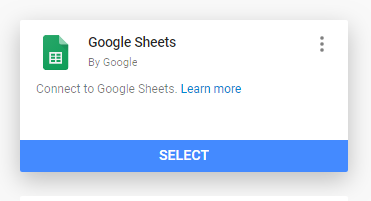
We can Choose Google Sheets as our Connector.
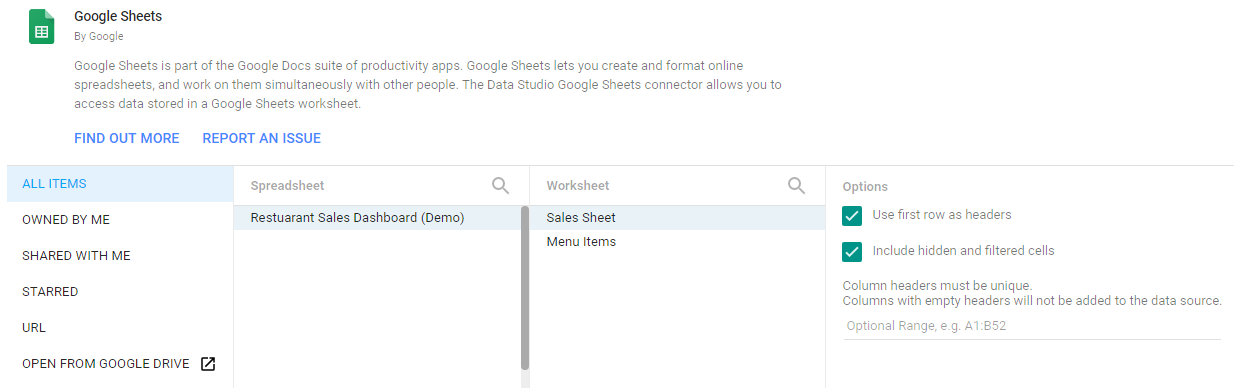
Then choose the Sales Sheet from the Spreadsheet.
We’re then able to see the fields.
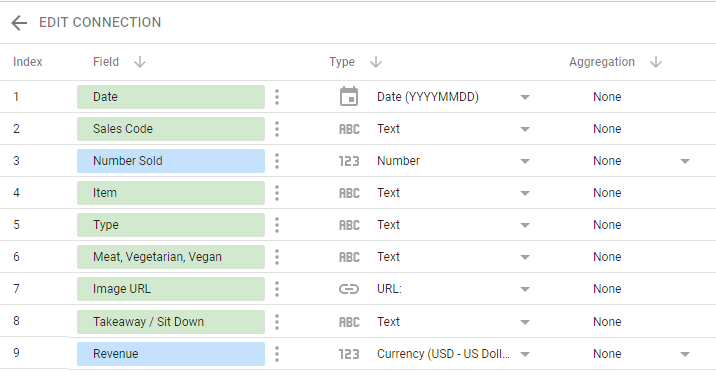
Because colourful photos make everything better, we will create a Photo field.
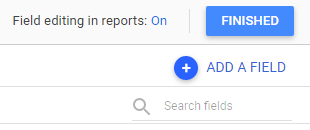
We can click on ‘Add a Field’ in the top right corner of the screen.
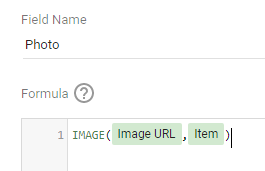
And then we can use the IMAGE function to create an image field.
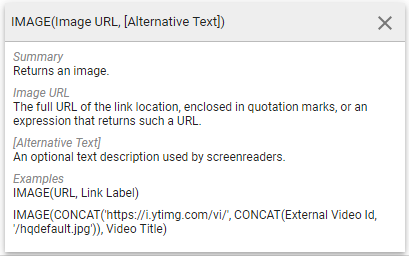
We just need to choose our existing Image URL field in the formula. It’s also possible to add in Alternative Text info, by adding in the Item field after a comma.
Now that we’ve created our Image field we are good to go!
Let’s go through a breakdown of some of the main charts on the page.
One thing we can see on the report is an image that changes depending on which item on the menu you select. As shown below if we click on an item its picture appears on the right.
To create the list of items table, we can create a table with the Dimension being “Type” (as in the type of food ordered) and the Metrics being the Number of items sold (Number sold) and Revenue. It is also important with this table to make sure we have the “Apply Filter” checkbox ticked under “Interactions”. This will allow us to filter the image table on the right.
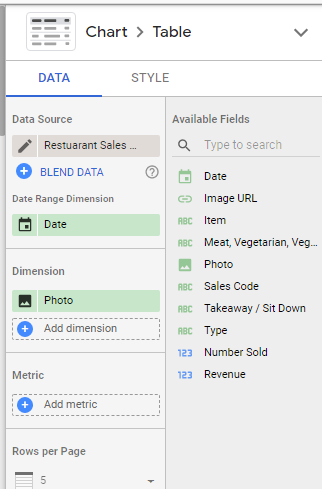
We now need to create the Image table, which will show a single image of the food item selected. We can do this by creating a table with just “Photo” as our Dimension and no metrics at all. We also need to resize the table so that it displays just one image at a time.
The other charts in this report are fairly simple to set up, and we can go through a brief summary of each to see how it’s made.
For the Pie Chart showing a breakdown of Revenue of each type of food sold, we can setup the Dimension as Type and the Metric as Revenue. We can also enable filtering (by selecting the checkbox labeled “Apply Filter” under Interactions.
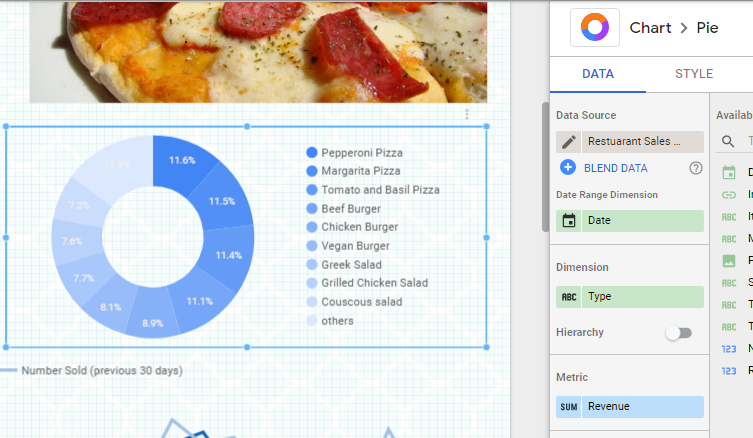
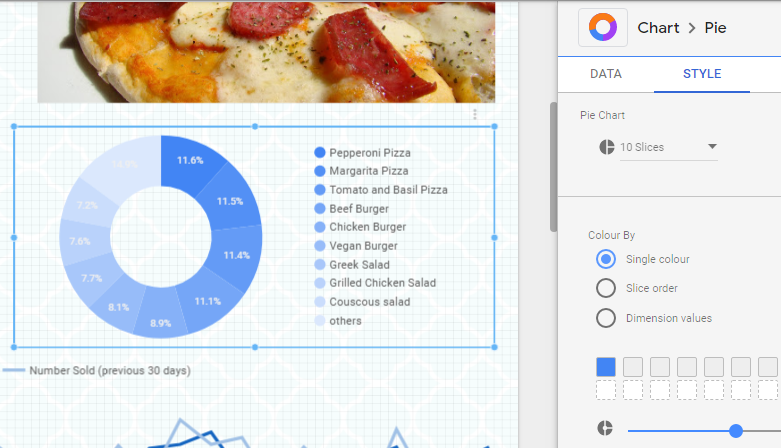
In terms of the style of the Pie Chart we can use one colour to keep it in the style of the rest of the report.
The time series line graph showing the number of items sold compared to the previous month is fairly simple to set up. Simply create a time series chart with the Time Dimension being Date and the Metric being Number Sold.
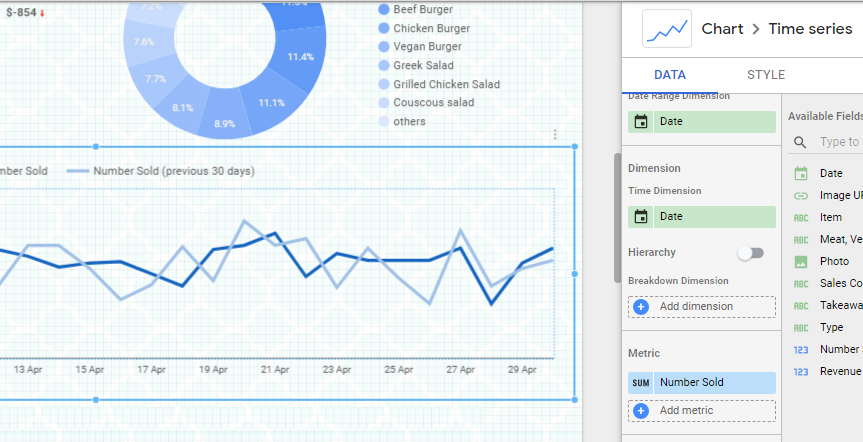
In order to see a comparison to the previous period simply select click on Comparison rate range and choose Previous period.
Next on the report we have three pie charts showing a breakdown of orders by various Dimensions. You’ll notice that I’ve decided to colour these pie charts with specific colours.
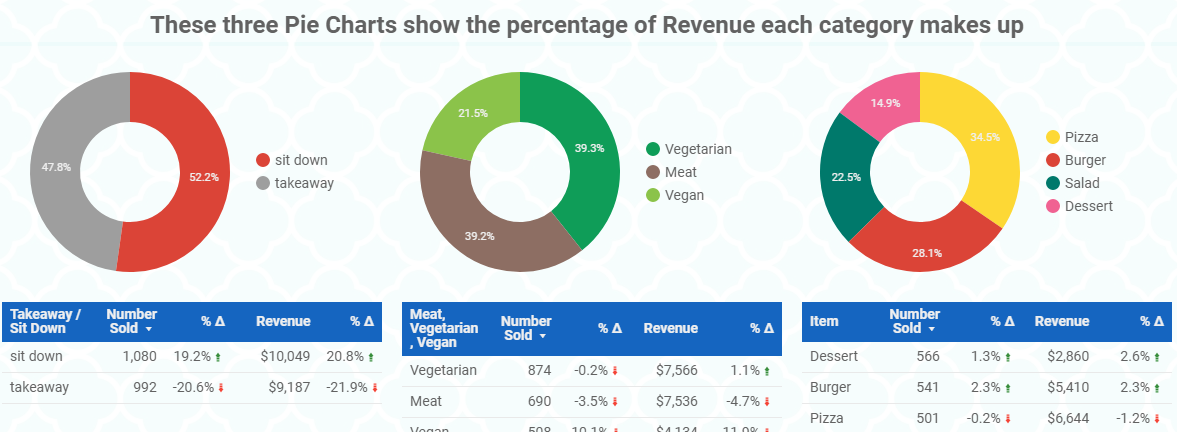
In order to choose which colours you want to appear in these charts open up the Style tab of the chart. Then click on “Manage dimension value colours”. You then have the open of changing the values to specific colours.
For example, we can decide what colour “Pizza” should be. Our pie chart displaying what percentage of orders were “Pizza” then displays this colour.
The final chart on our report is a summary of revenue by month.
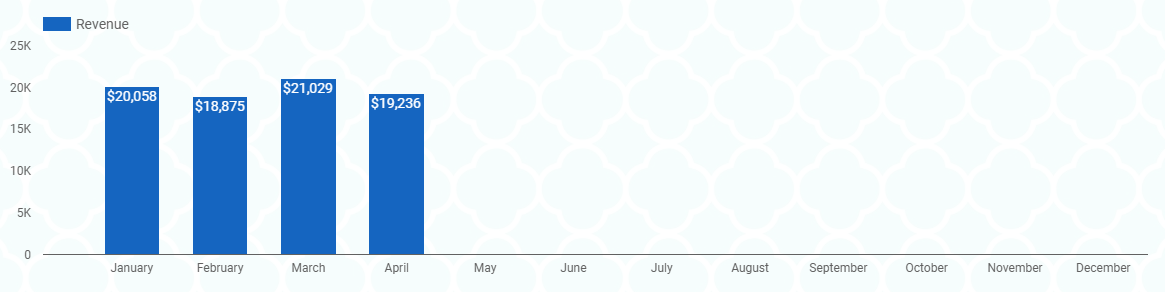
To get this time series to display the revenue by Month (and not by the default Date) click on the Edit Option for the Date dimension. Then click “Show as” to display it as Month.
And that is how you can build a Sales dashboard for your small business! It’s important to note that the data you have from your CRM or from your point of sale might be in a different format than the examples given in this post.
However, if you’re able to spend some time putting your data into a format that Data Studio can understand, you’ll be able to create effective reports and dashboards to help understand your business’ performance.

