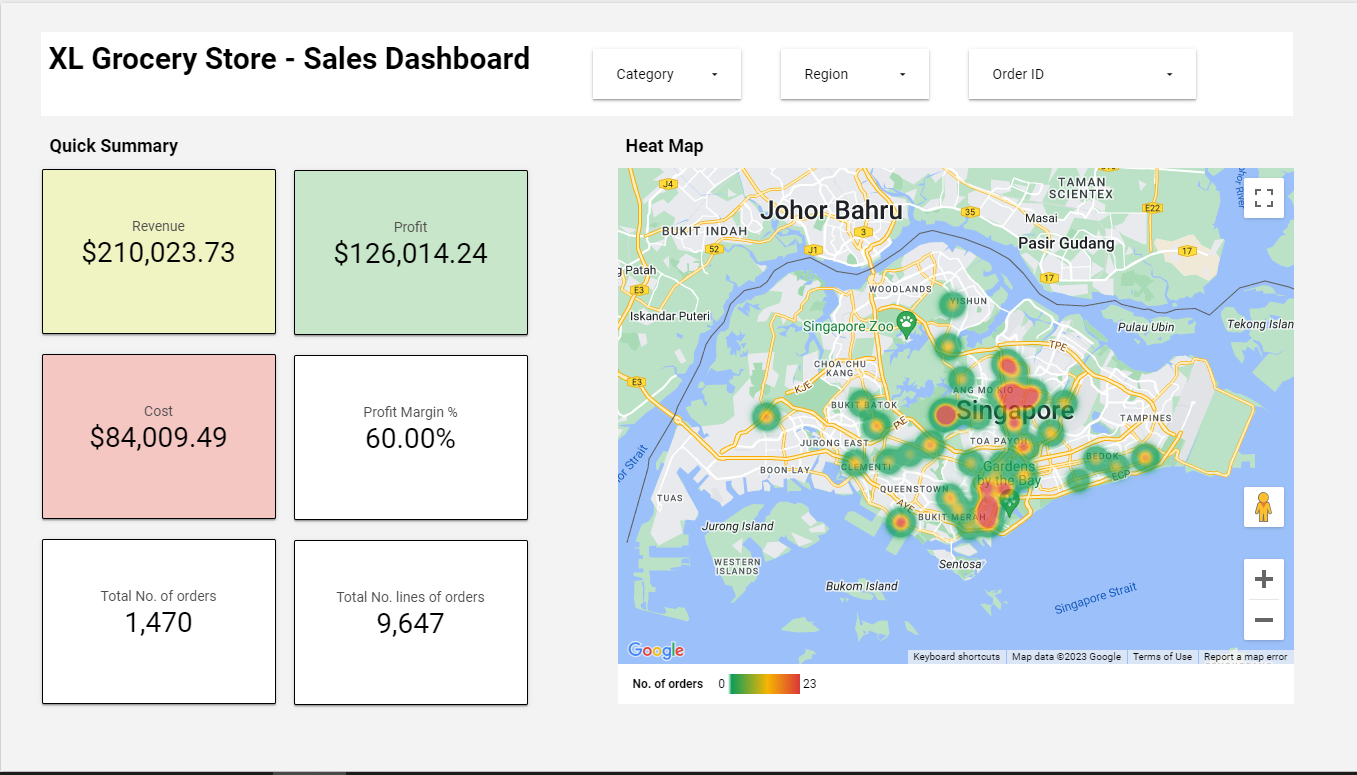
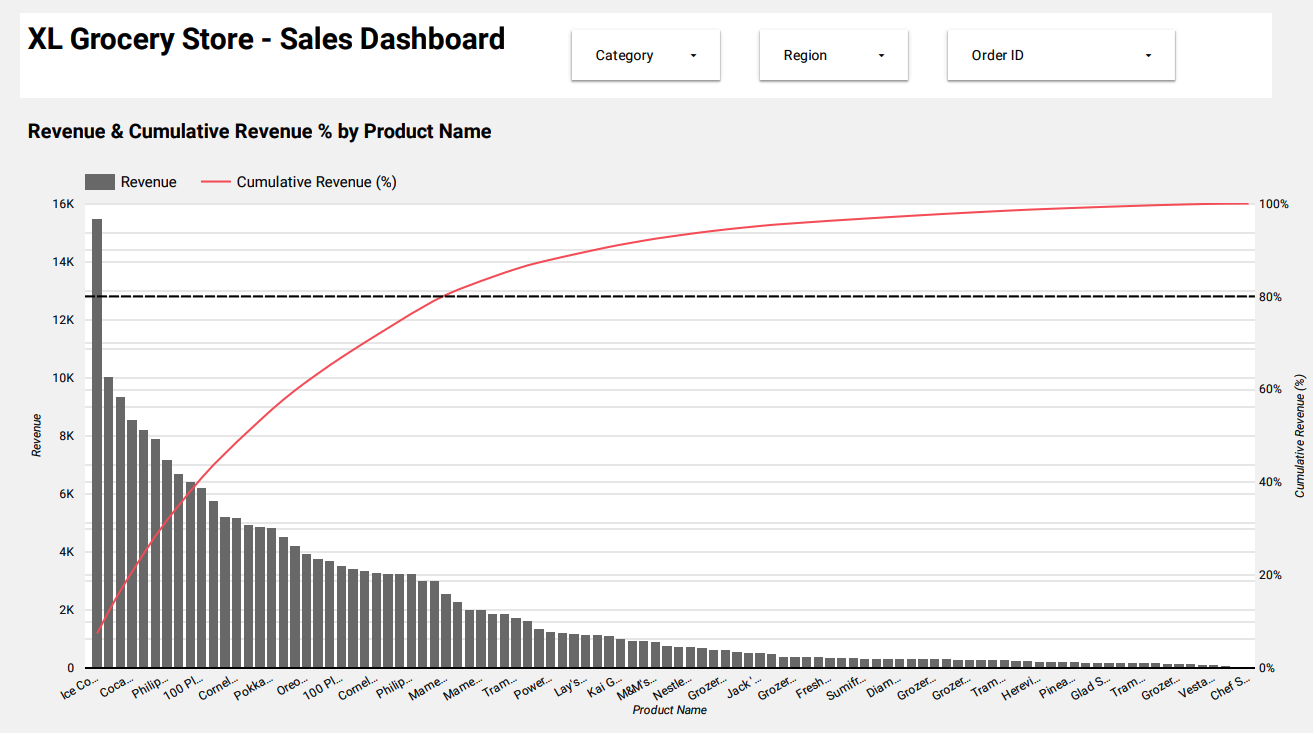
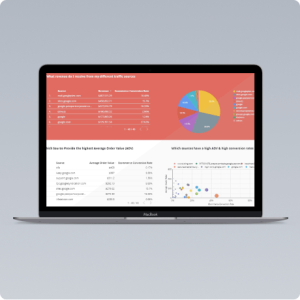
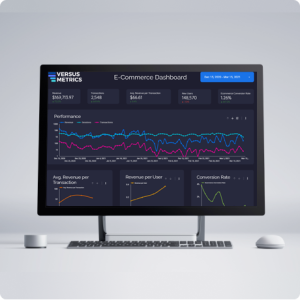
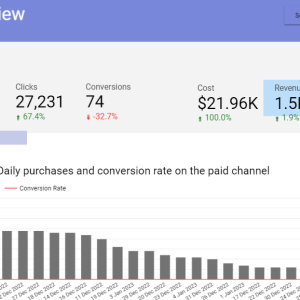
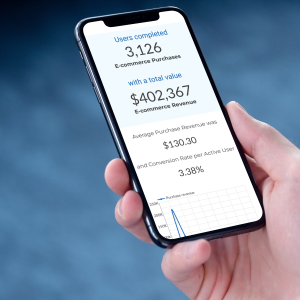
This a visual representation of sales and marketing metrics, designed to provide an at-a-glance view of performance against targets. It uses graphs, charts, tables, and other visual aids to present data in an easily digestible format.
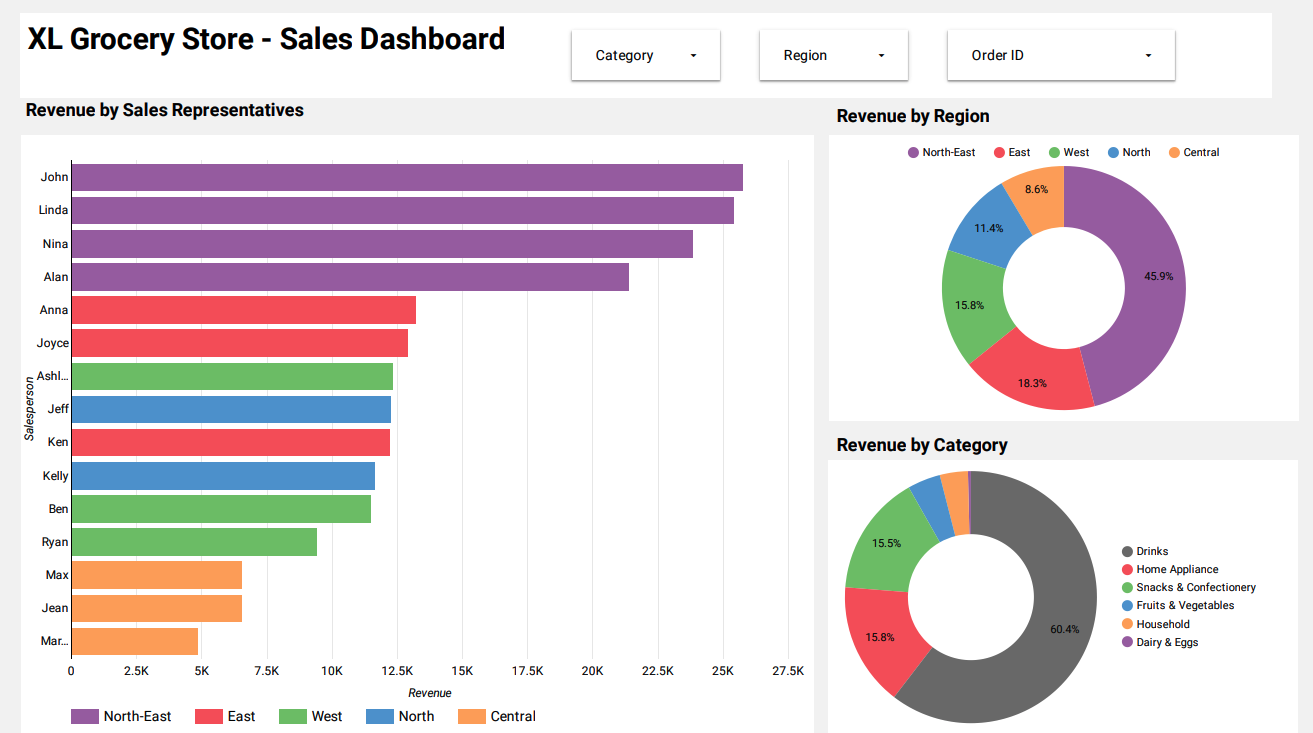
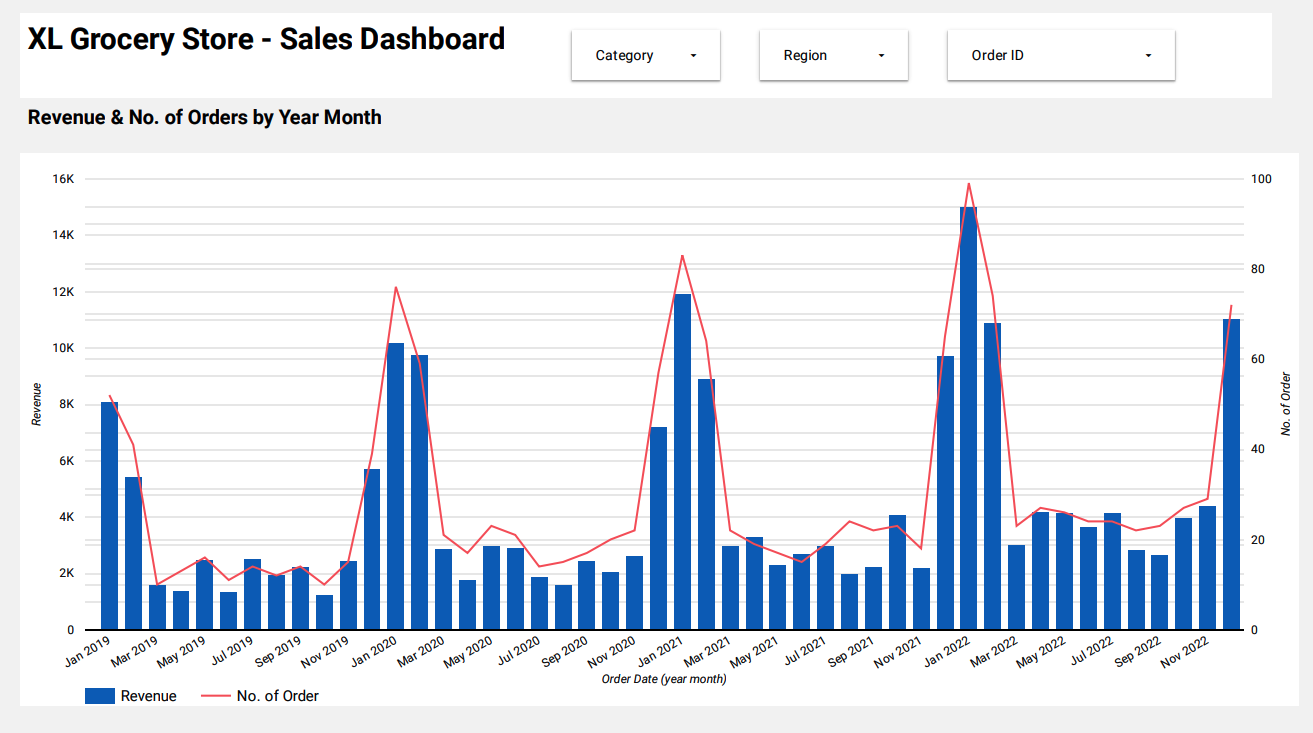
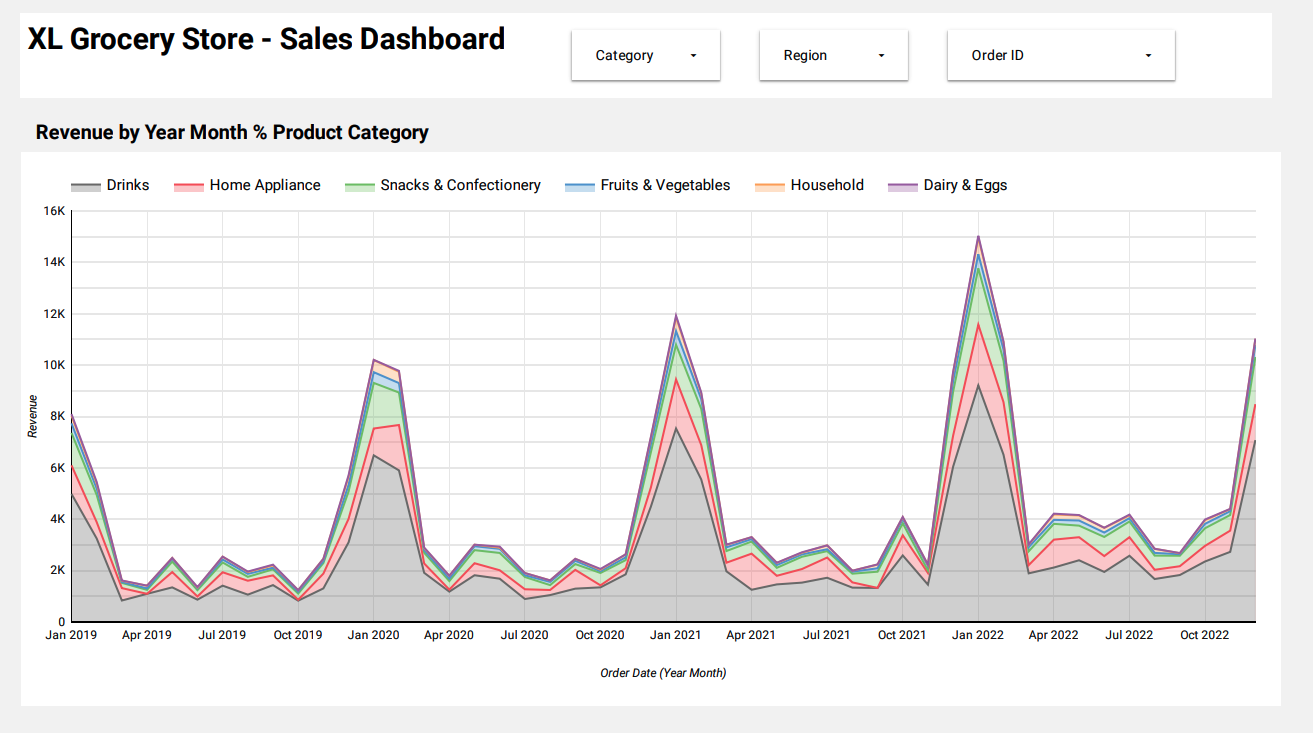
Some example of what the visual aids are about are the Total Sales, Sales by Product and Sales by Region
The source can be retrieved from this google sheet link below
https://docs.google.com/spreadsheets/d/1-CGRHoJcBpH2IQV8Clcto7ODlv2VEOKP/edit?usp=sharing&ouid=104168984767327494876&rtpof=true&sd=true