Menu


In this article, we are going to explain how to use calculated fields in Google Data Studio.
A ‘field’ is a specific metric used in a data visualisation report. A metric is a measure used to quantitatively track or assess progress, performance, quality and more.
In GDS, once a data source has been added, all of the fields within that data source are available to use in a report. By using ‘calculated fields’, it is possible to create new, custom metrics which derive from your data source. Calculated fields are essentially user-generated metrics.
So why would you want to create new custom metrics? Well, sometimes the pre-existing metrics are just not sufficient. Calculated fields are useful if you cannot answer certain questions with the available fields associated with your data. Some examples from Google Analytics could be Events per user which is total Events / Users or Product View per Session which is Product Detail Views / Sessions
In this article, we are going to explain the process of creating a new metric in 10 steps.
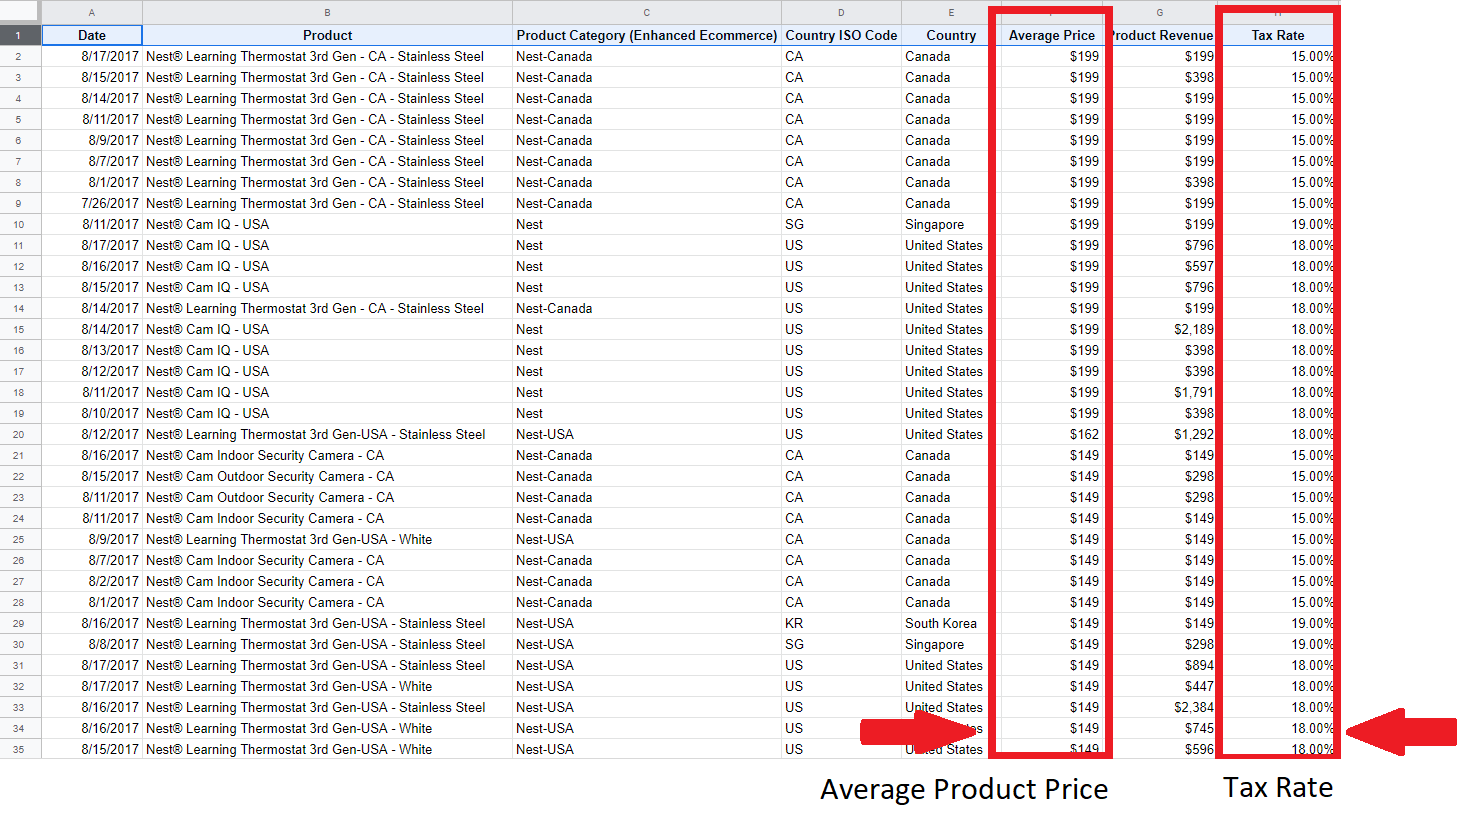
For this example, we are looking at two metrics, tax rates and product prices:
We want to be able to calculate the amount of tax that an individual customer would pay when they purchase a specific product. To work this out, the below calculation is used:
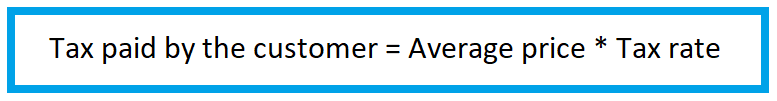
‘Tax paid by the customer’ is the new metric that we want to use in our data visualisations.
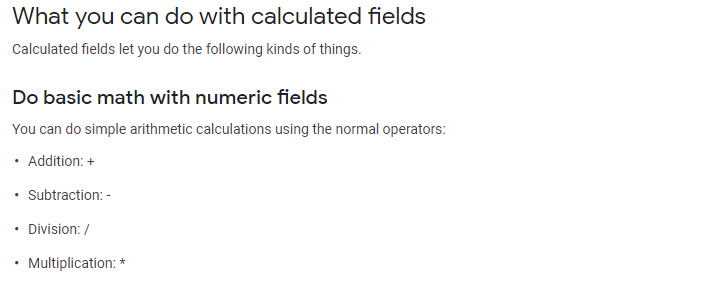
Addition (+), Subtraction (-), Division (/) and Multiplication (*). The operators (and formulas) used in GDS are the same as Microsoft Excel or Google Sheets:
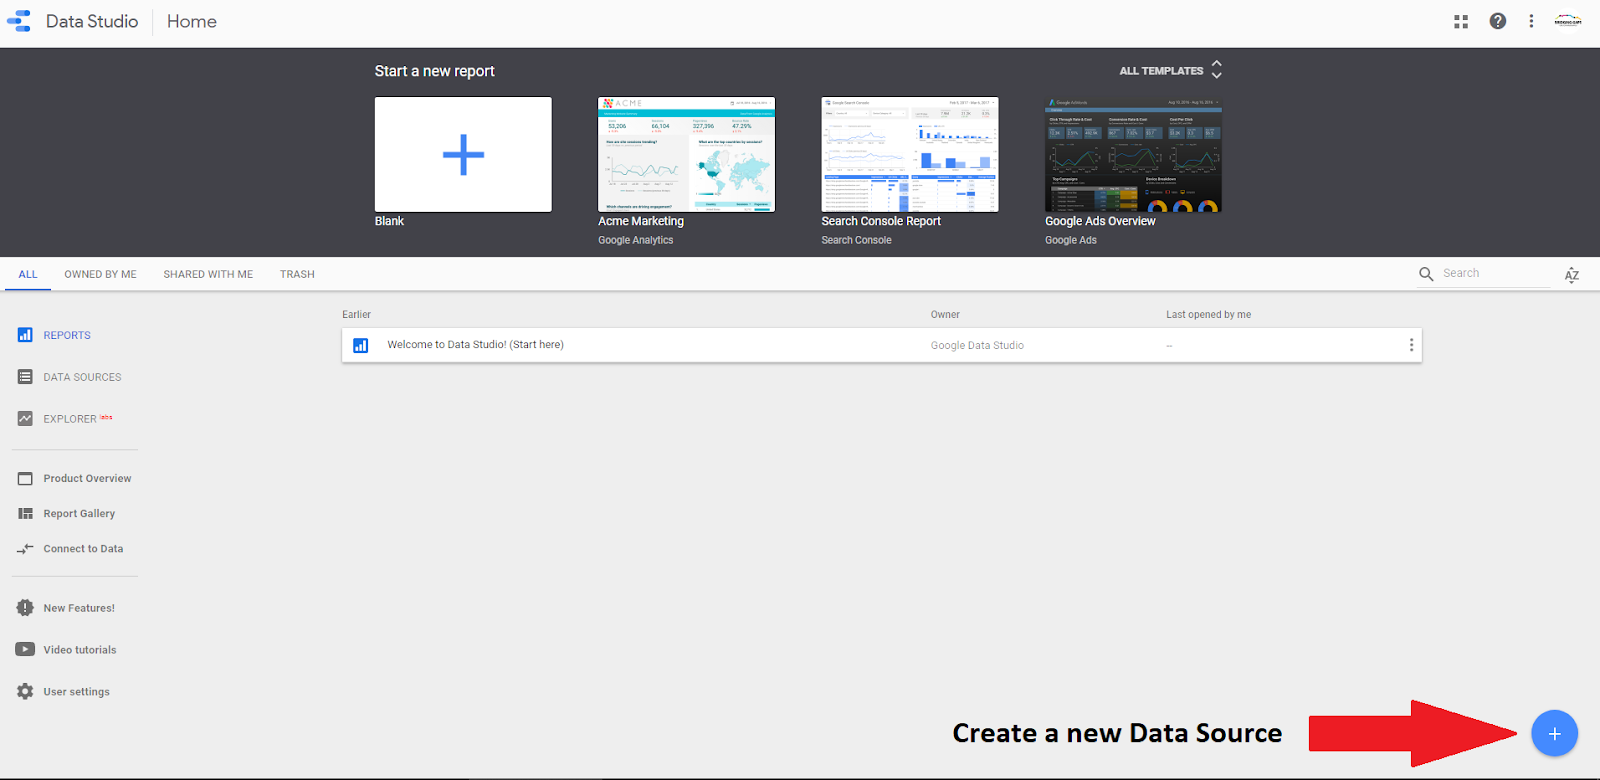
We are going to create a new metric called ‘Tax paid by customer’ using the data from our example data source. To begin, it is necessary to export the spreadsheet into GDS. In order to connect Google Sheets to GDS, a new data source needs to be created by selecting the ‘+’ in the bottom right-hand corner of the page in GDS.
You can revisit our previous article on how to connect Google Sheets to Google Data Studio.
You have the choice to edit the data in your existing report before exporting it to GDS, or it is also possible to edit your data source in the GDS home screen after you have exported it.
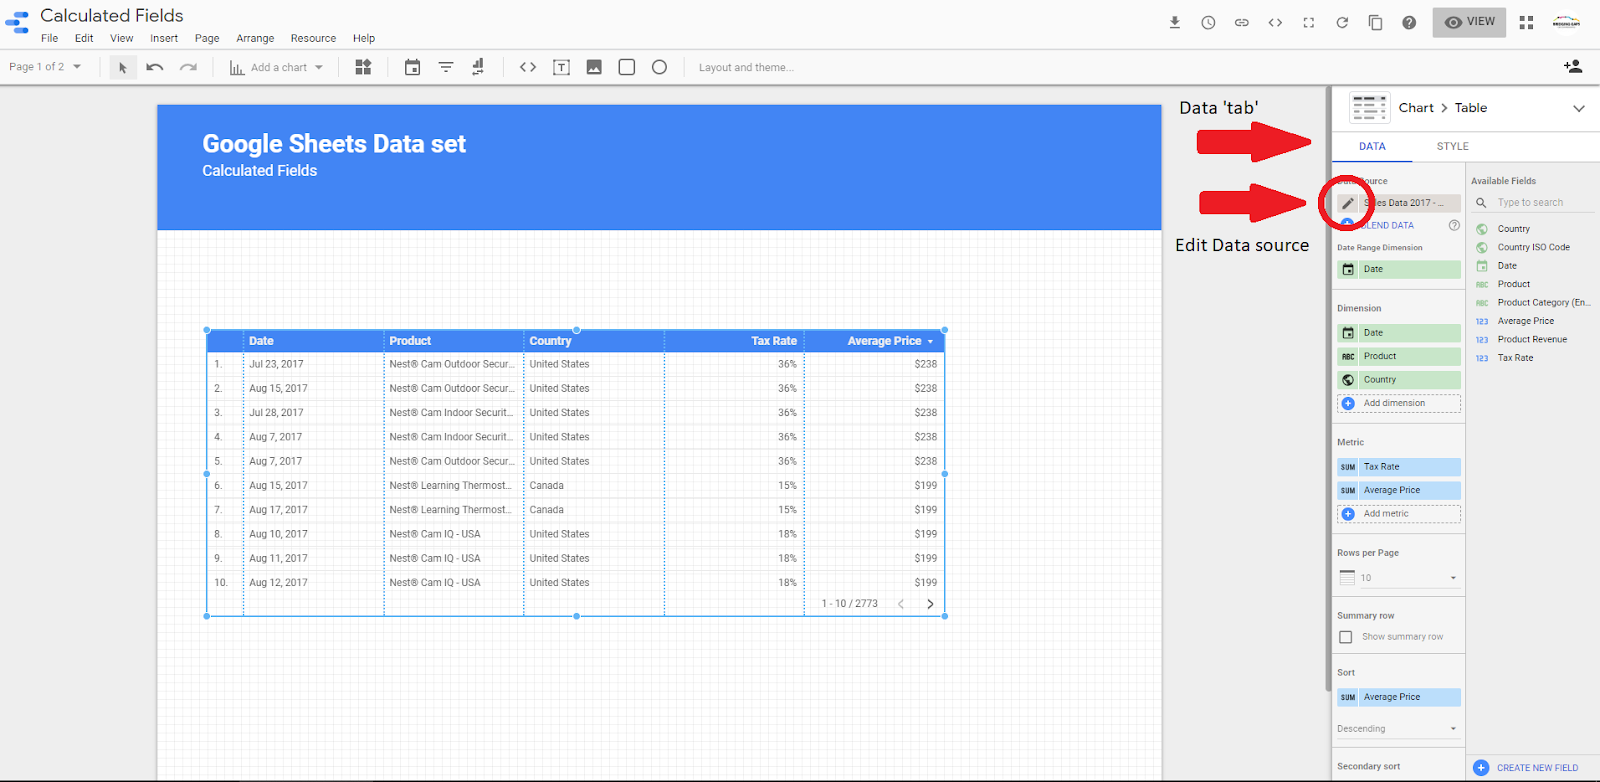
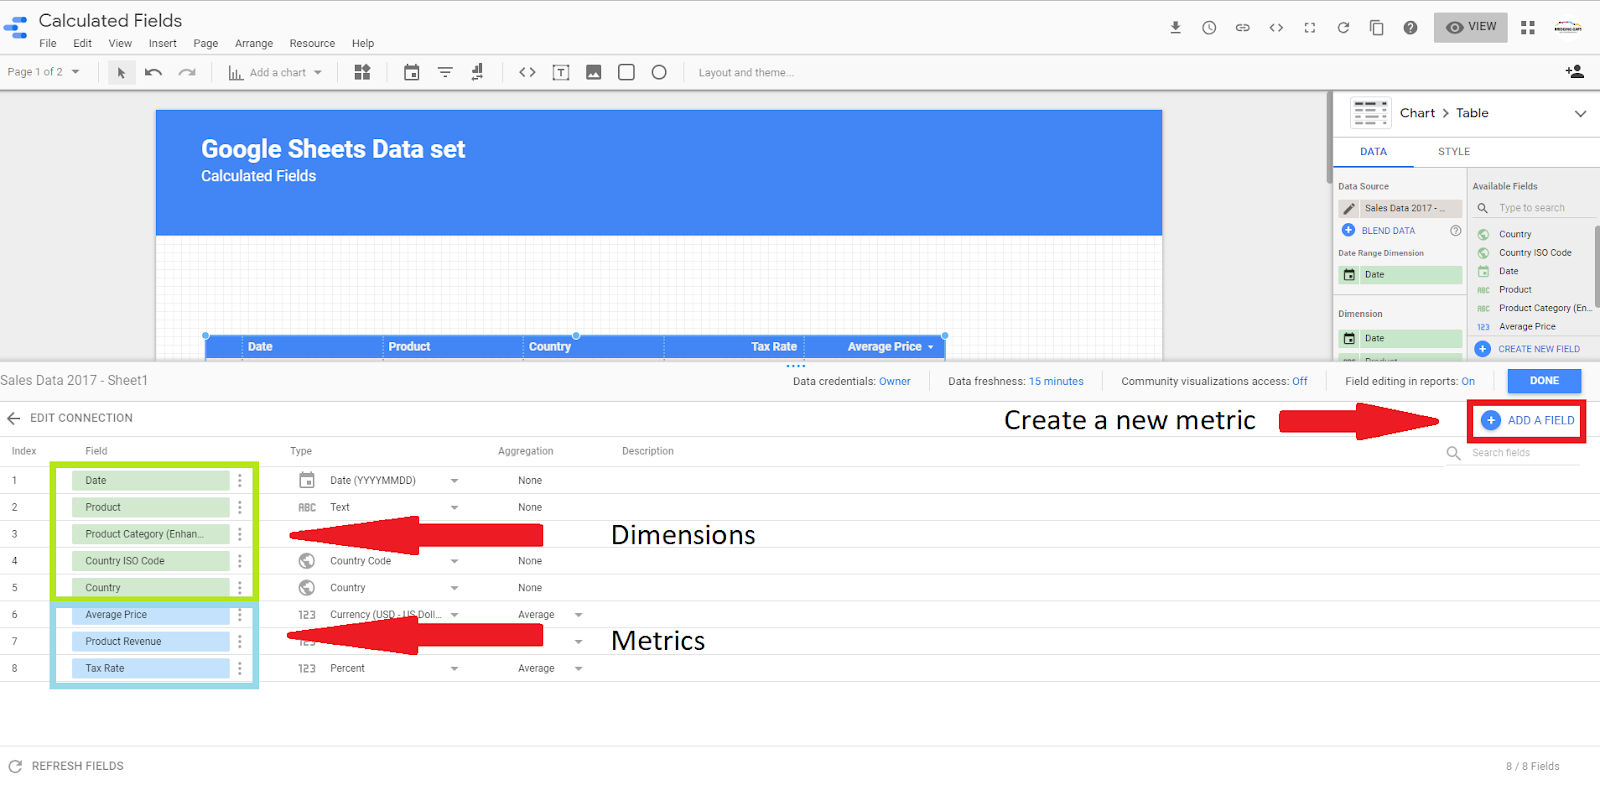
In the GDS home screen you will see a list of your metrics in blue, and your dimensions in green. To create a new metric select the ‘+ Add Field’ on the right-hand side of the screen.
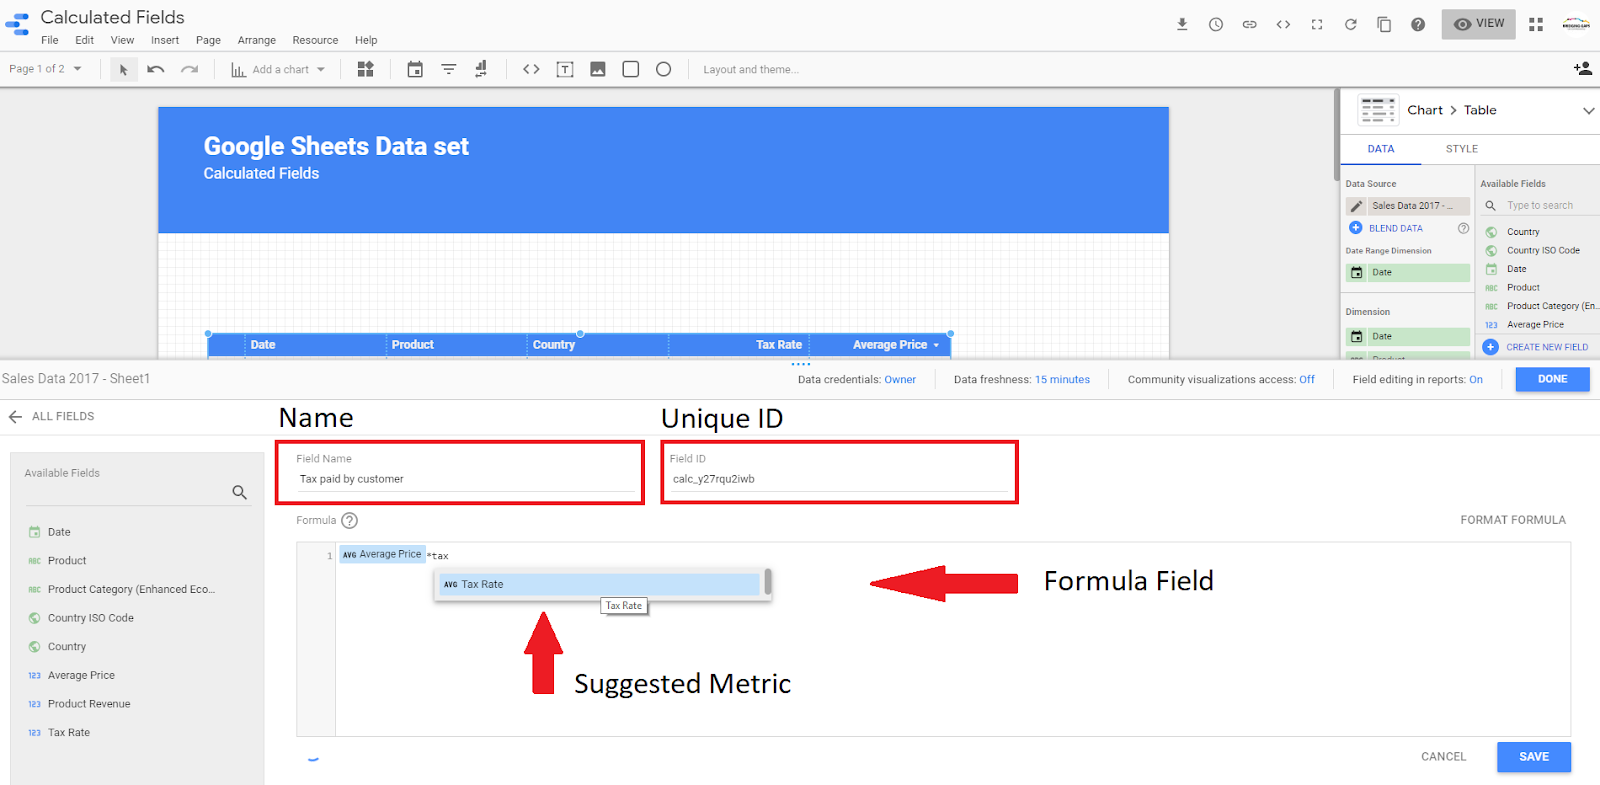
To start, enter a name for your metric. For this example we are using ‘Tax paid by customer’. GDS will then assign a Unique ID to your new metric – this does not need to be changed.
The next step is to input the formula for your new metric in the formula field:
When entering a new formula, GDS generates suggested metrics. Once you are finished inputting your formula, click save.
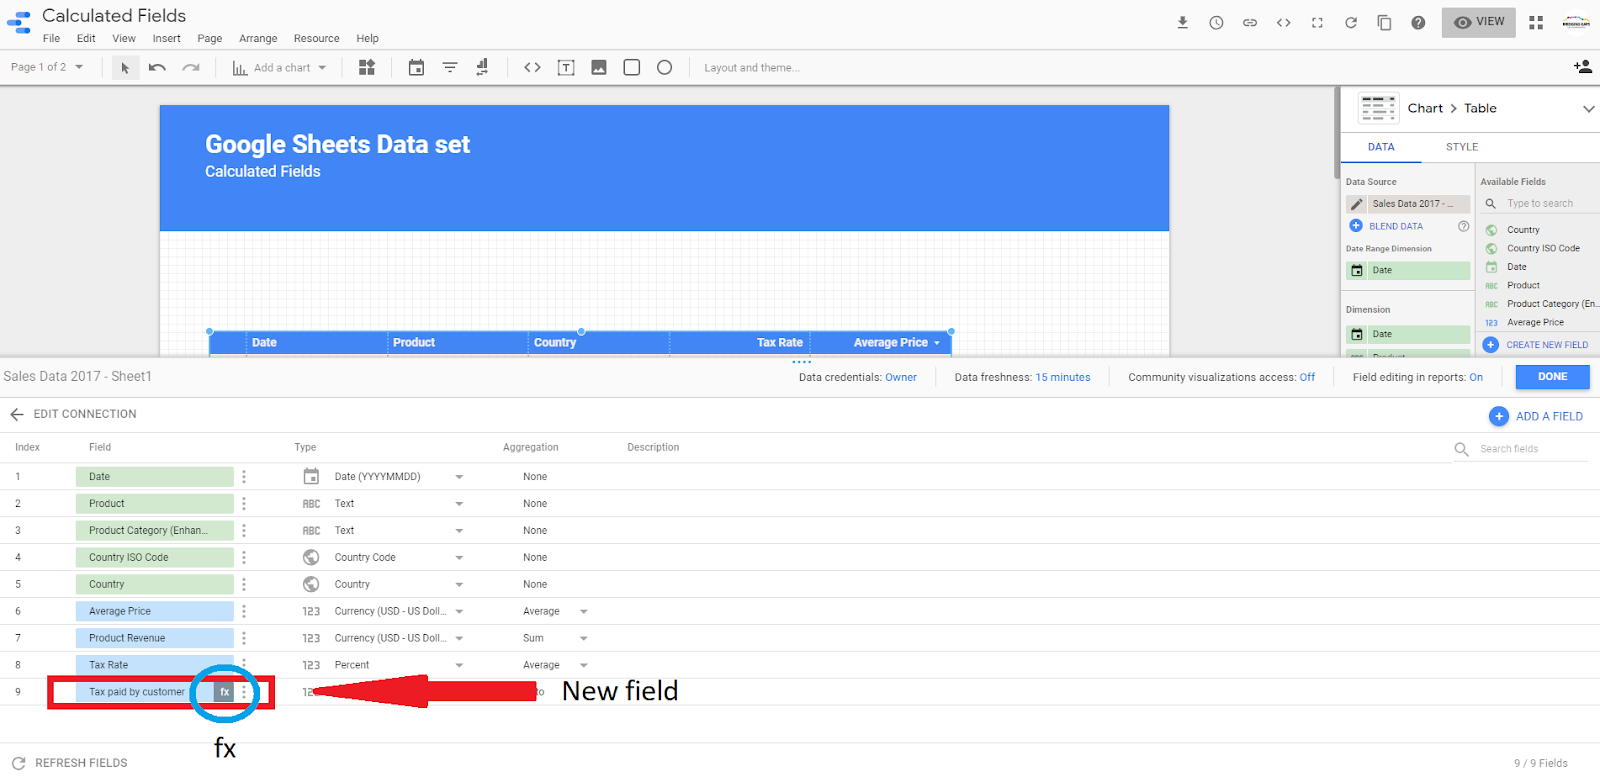
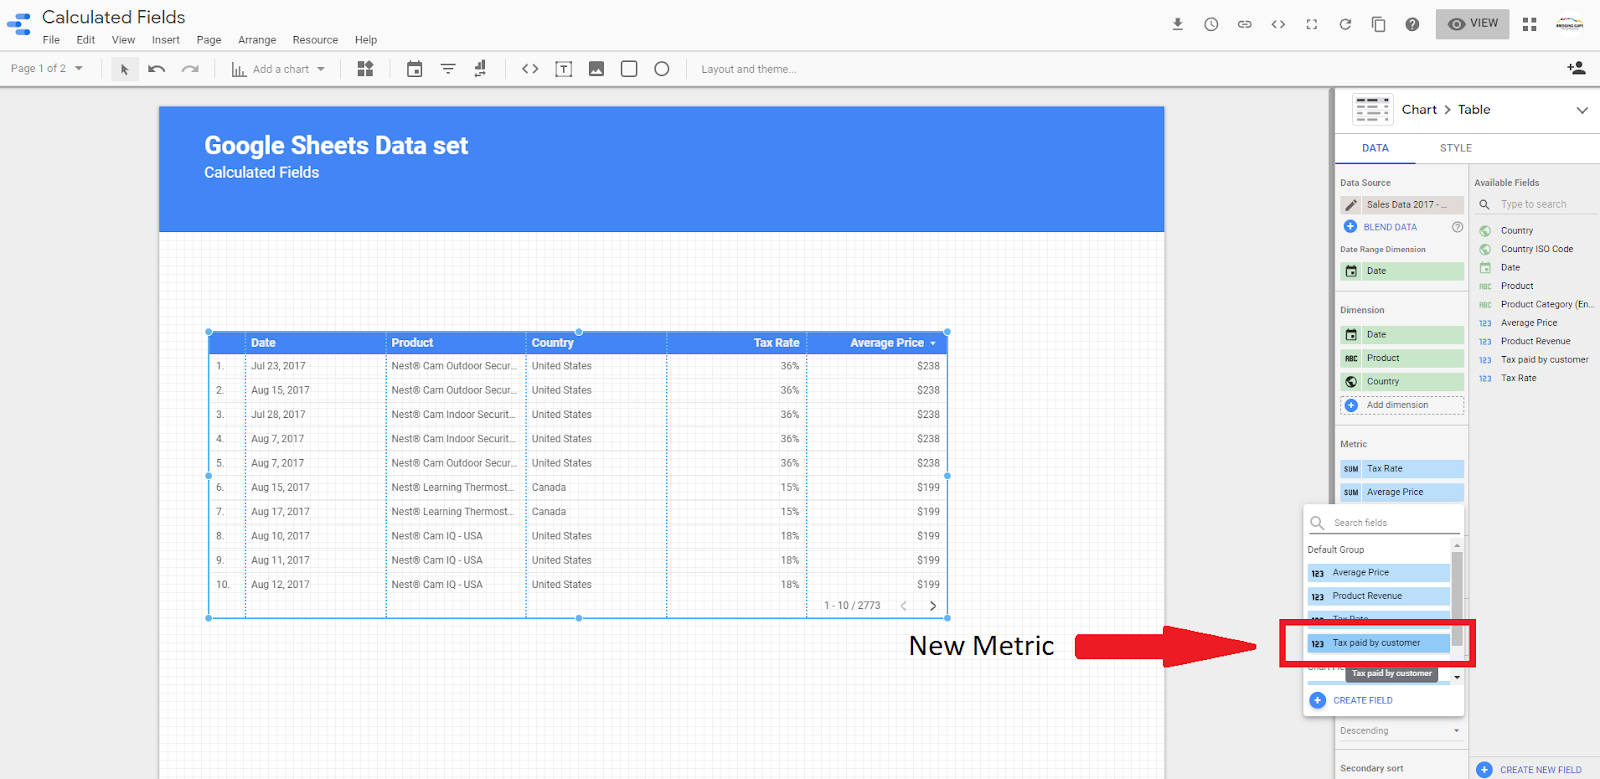
Your new metric will then display in your list highlighted in blue, with a small icon ‘fx’ indicating that it’s a calculating field.
Next, select the data type for this new field. For this example, it is ‘currency’. Once complete, select ‘done’.
Your new metric will then be available to add to your data visualisation.
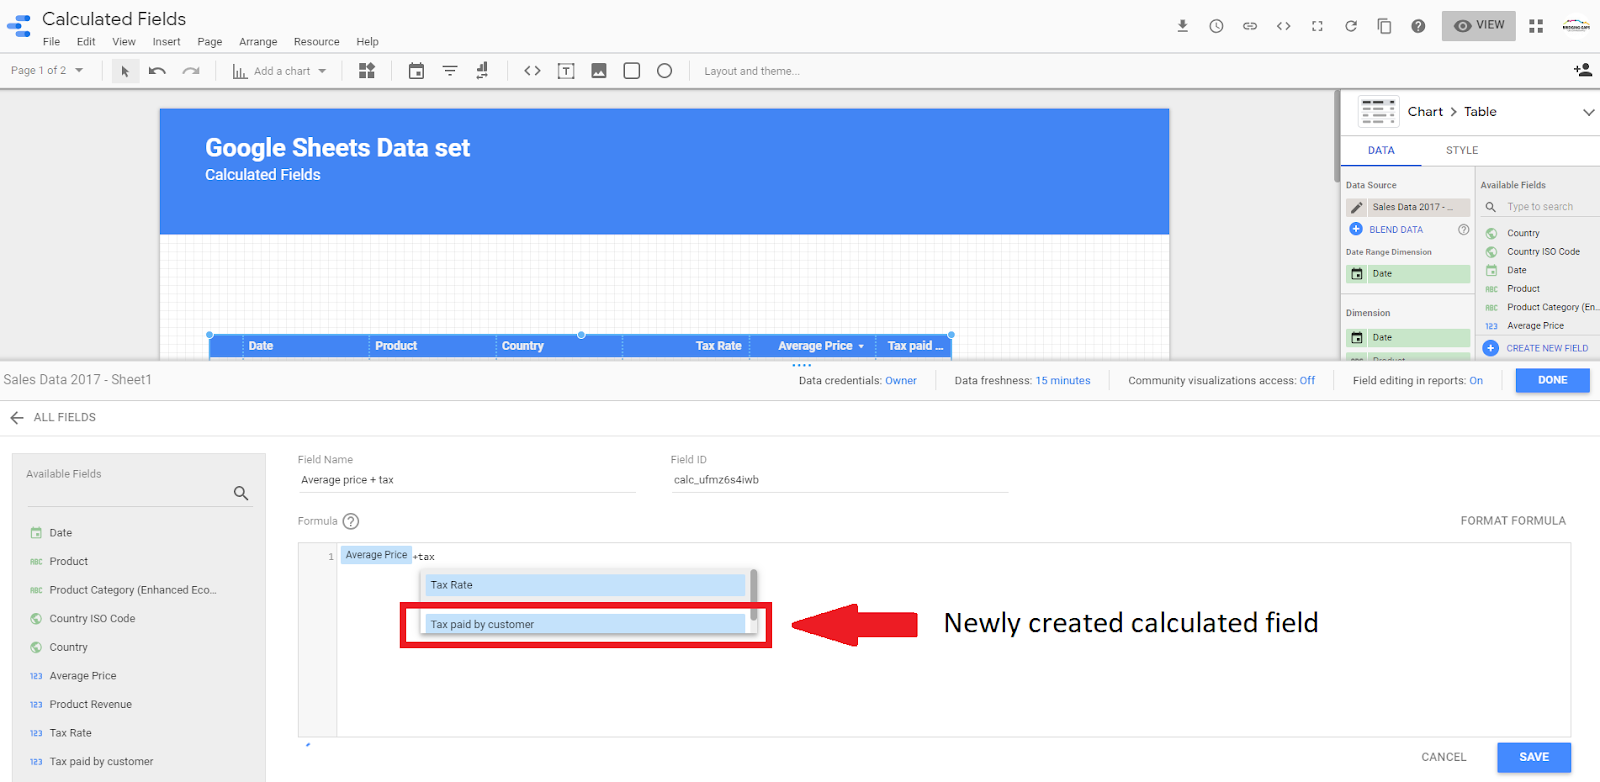
Once you have created a new calculated metric, you have the ability to use it when creating additional ones. Below we have created another custom metric, ‘Average price + tax’, by referencing ‘Tax Paid by Customer’.
You can create custom metrics for any type of data source to assist you in enhancing your existing datasets. This is a great way to complement your dashboard.
We hope this article was helpful and has assisted you in improving your knowledge in Google data studio.

