Menu


In this article, we are going to learn how to connect Google Sheets to Google Data Studio. We will explain how to correctly set up Google Sheets, before going on to explore how GDS imports information into a report.
There are two main scenarios when connecting Google Sheets to GDS may be useful:
We recommend reviewing the previous articles in our ‘how to’ series to give you a basic understanding of Google Data Studio.
This article consists of 2 sections:
Here are 15 steps to follow in order to create a report with GDS using imported data from Google Sheets.
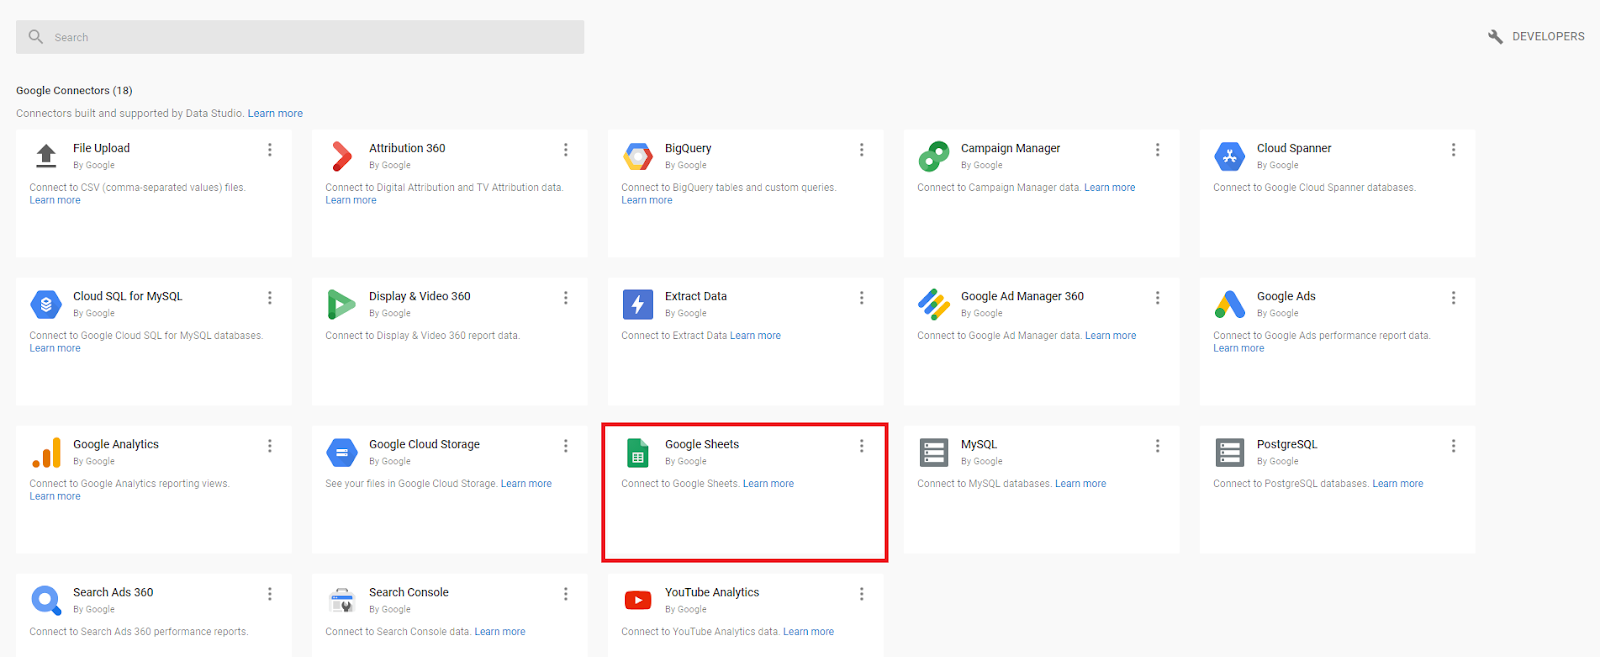
1) It is possible to power a GDS report with a range of different data connectors, one of which is Google sheets – Google’s version of Excel.
2) In order to create a Google Sheet, click on this link and sign into your Google account.
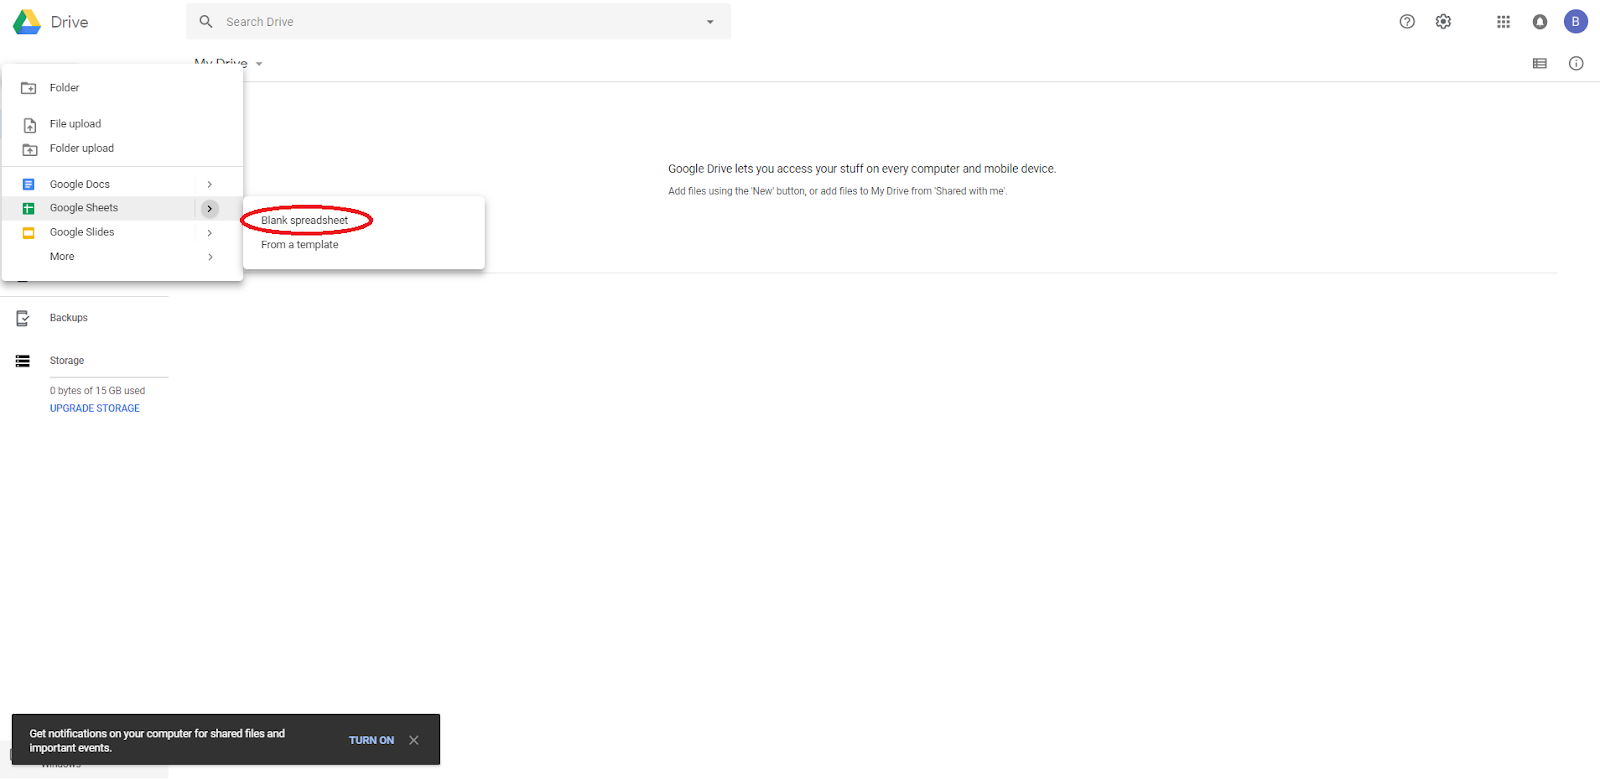
3) Google Sheets is a web-based application which allows users to create and edit data stored in a spreadsheet, which is shared live online.
To ensure that GDS imports the information from Google sheets correctly, it is necessary to display the data in a specific format. Below you will find an example of a Google Sheets table showing results from a merchandise store.
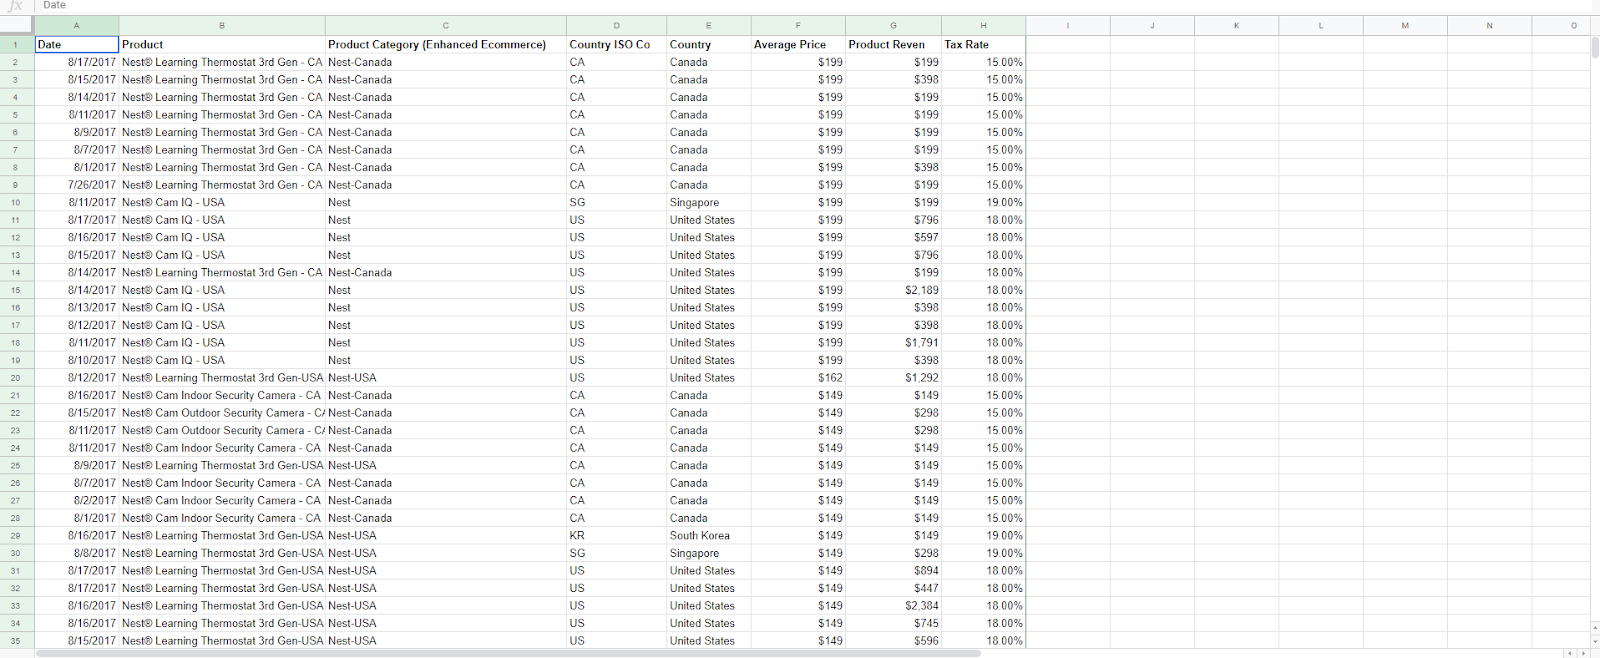
The data in Google Sheets needs to be stored in a table format. In the first row of the table, each column needs to contain a header.
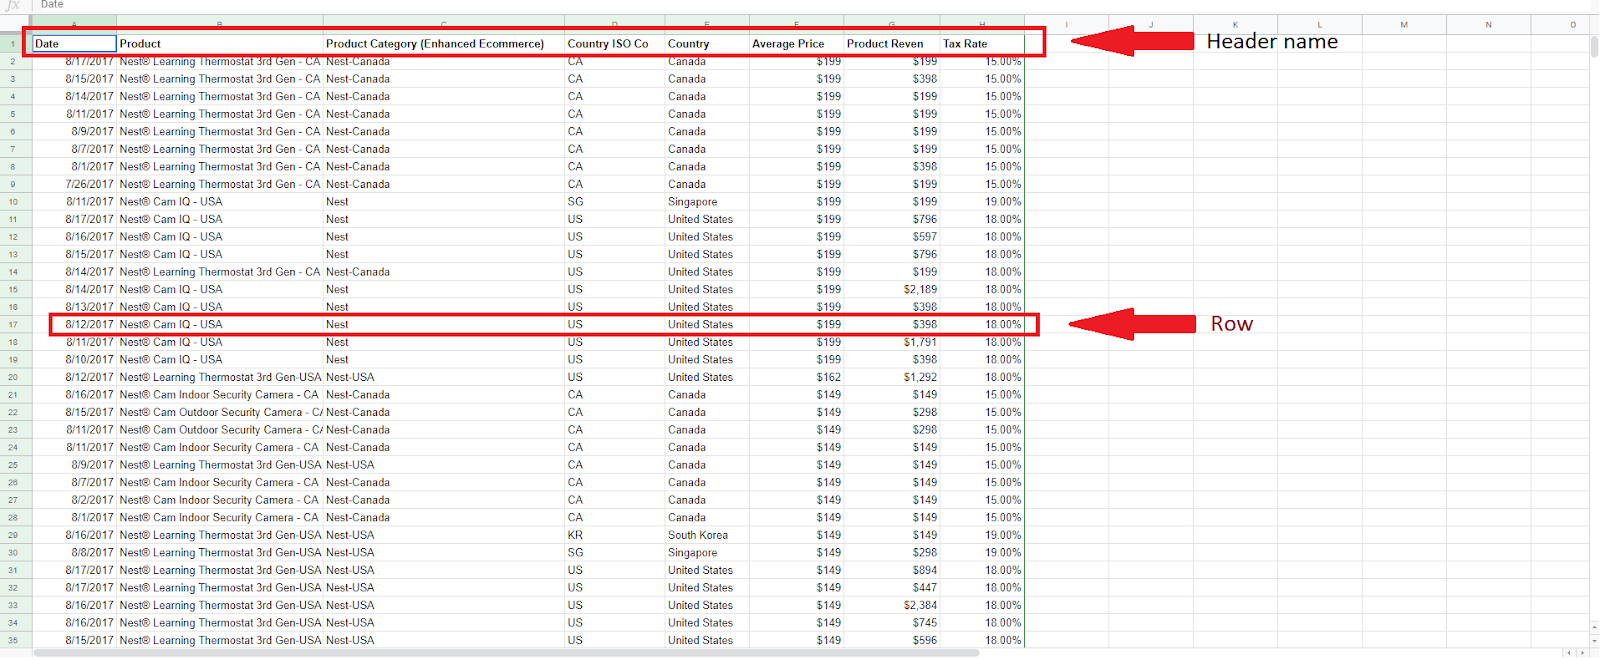
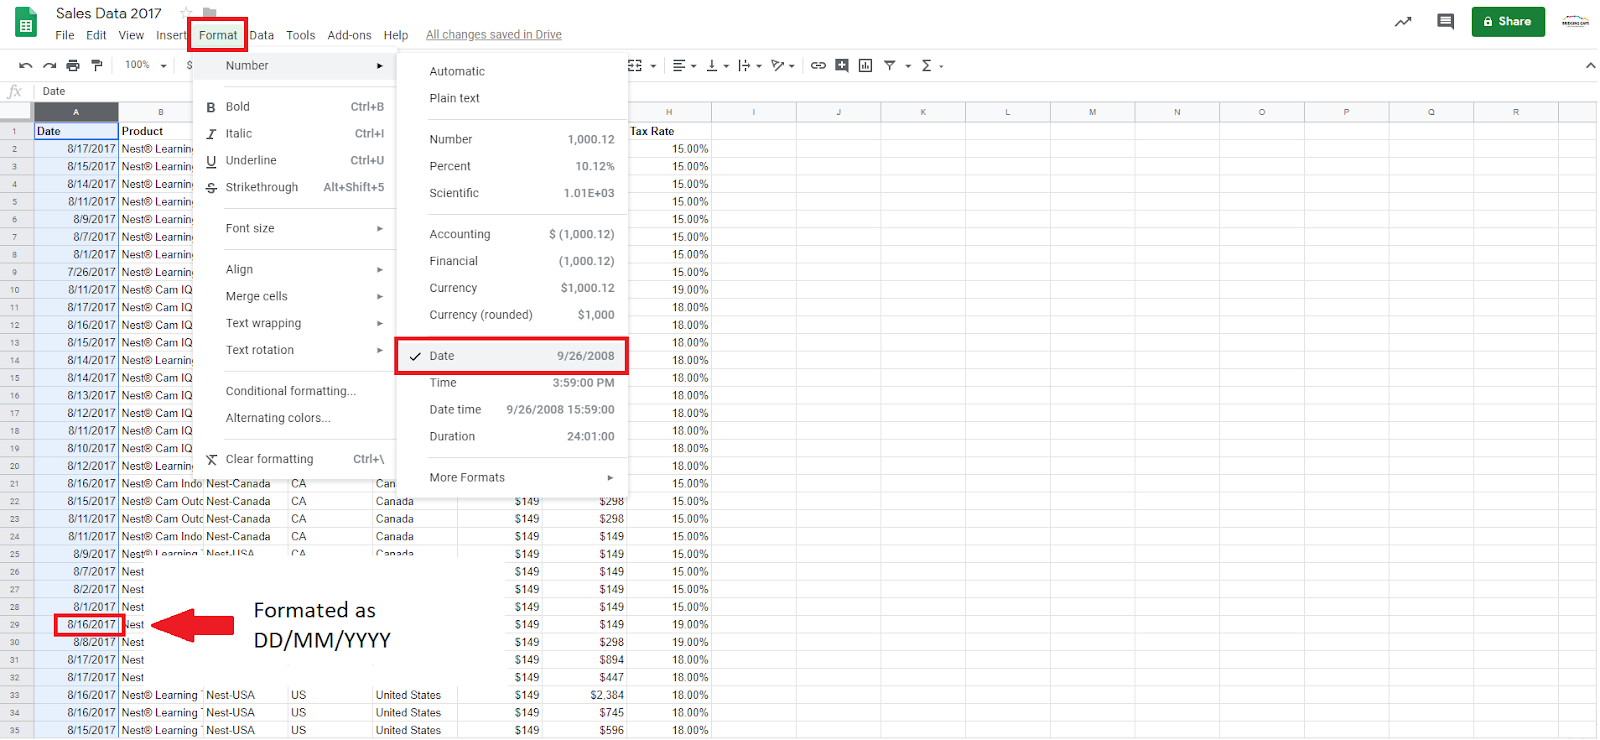
4) In this example, we have used the following headers; date, product type, country the product was sold in, average price, product revenue and tax rate. We are working with 4 main types of data: date, text, currency value, and percentage. It’s necessary to check that each type of data is correctly formatted.
Date example:
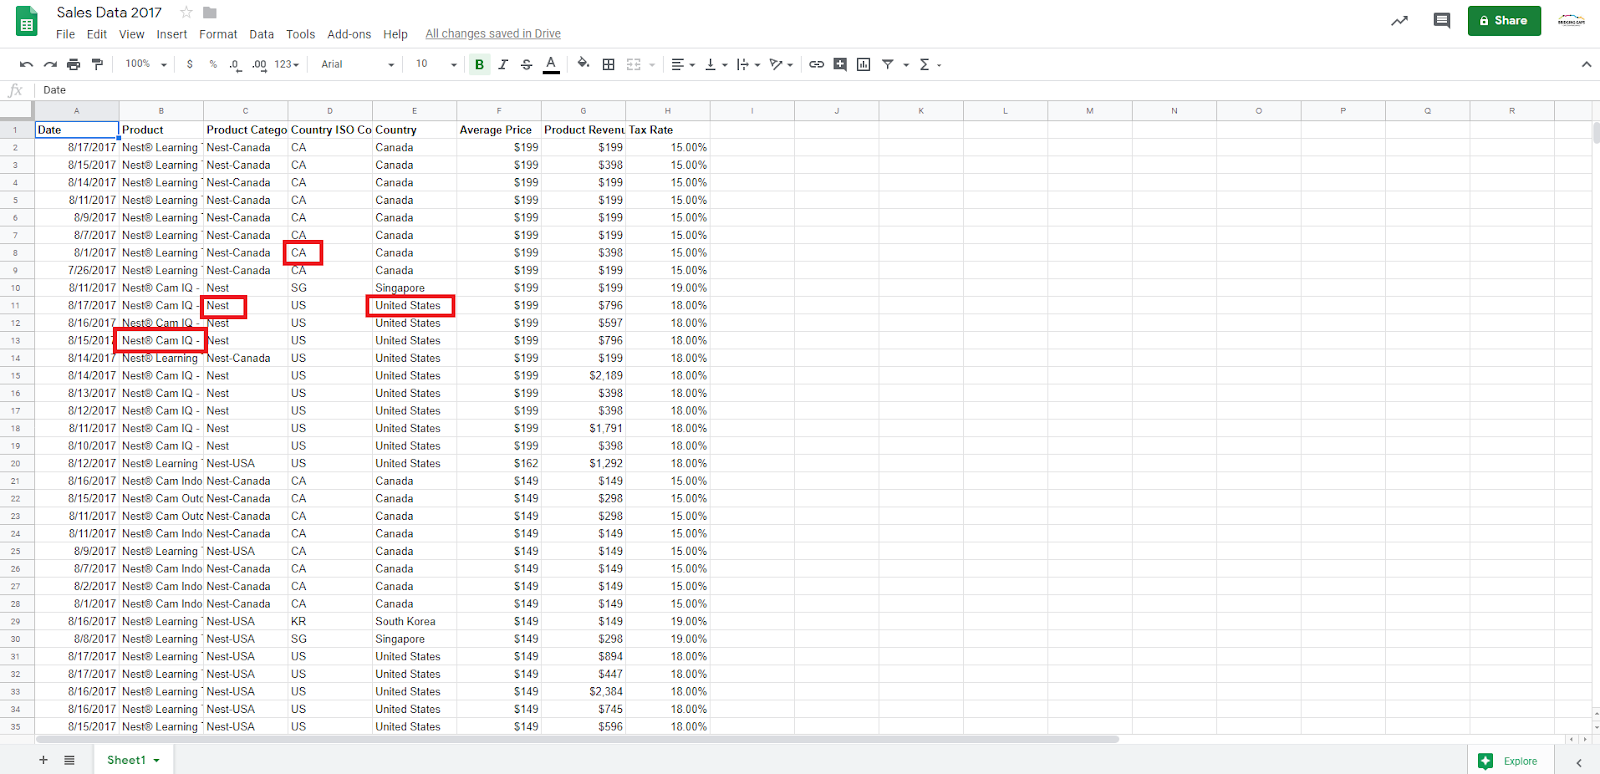
Text example:
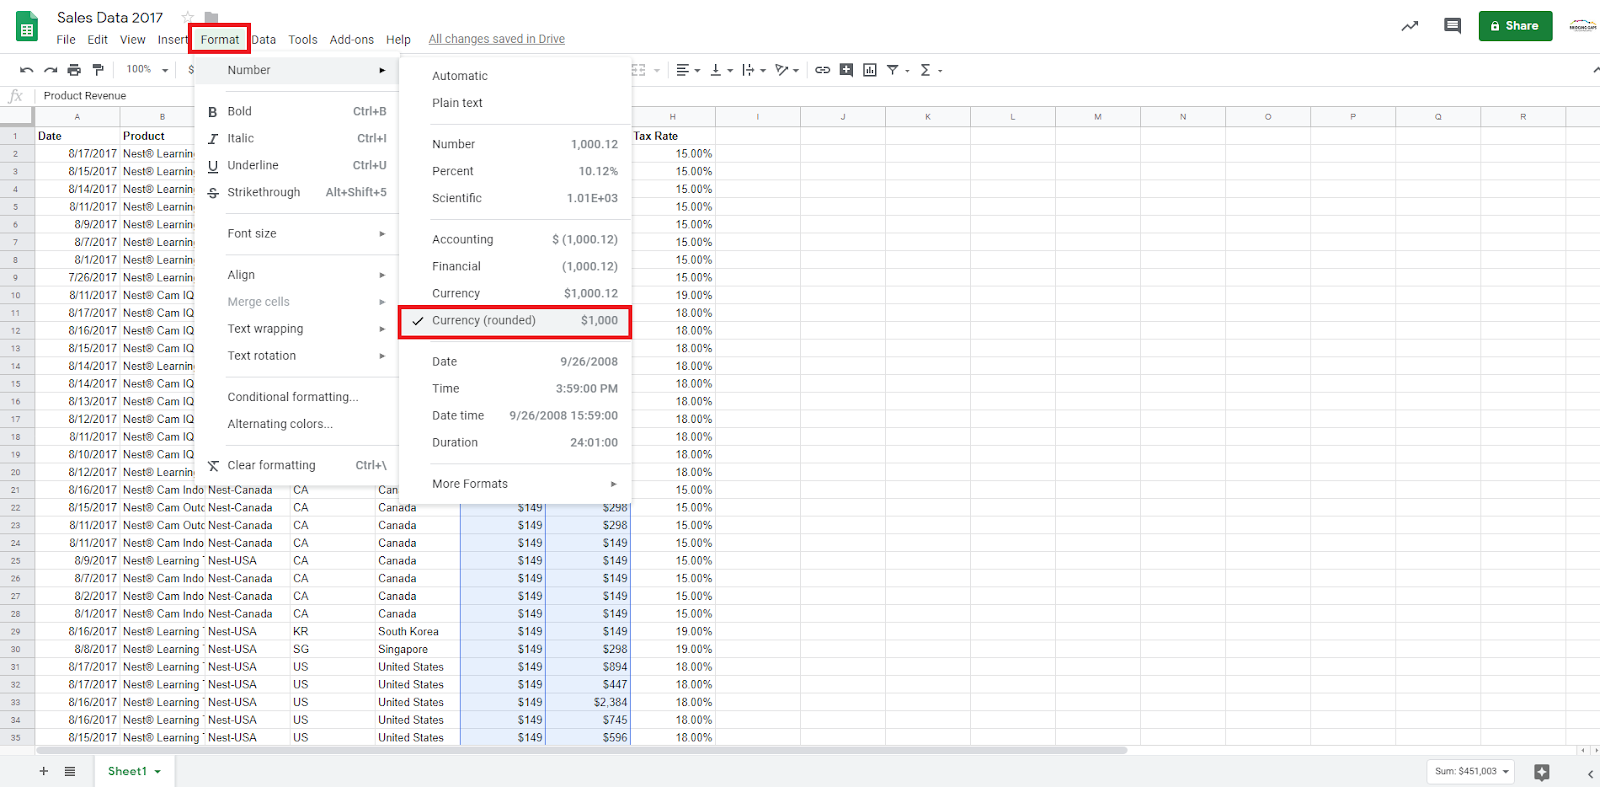
Currency example:
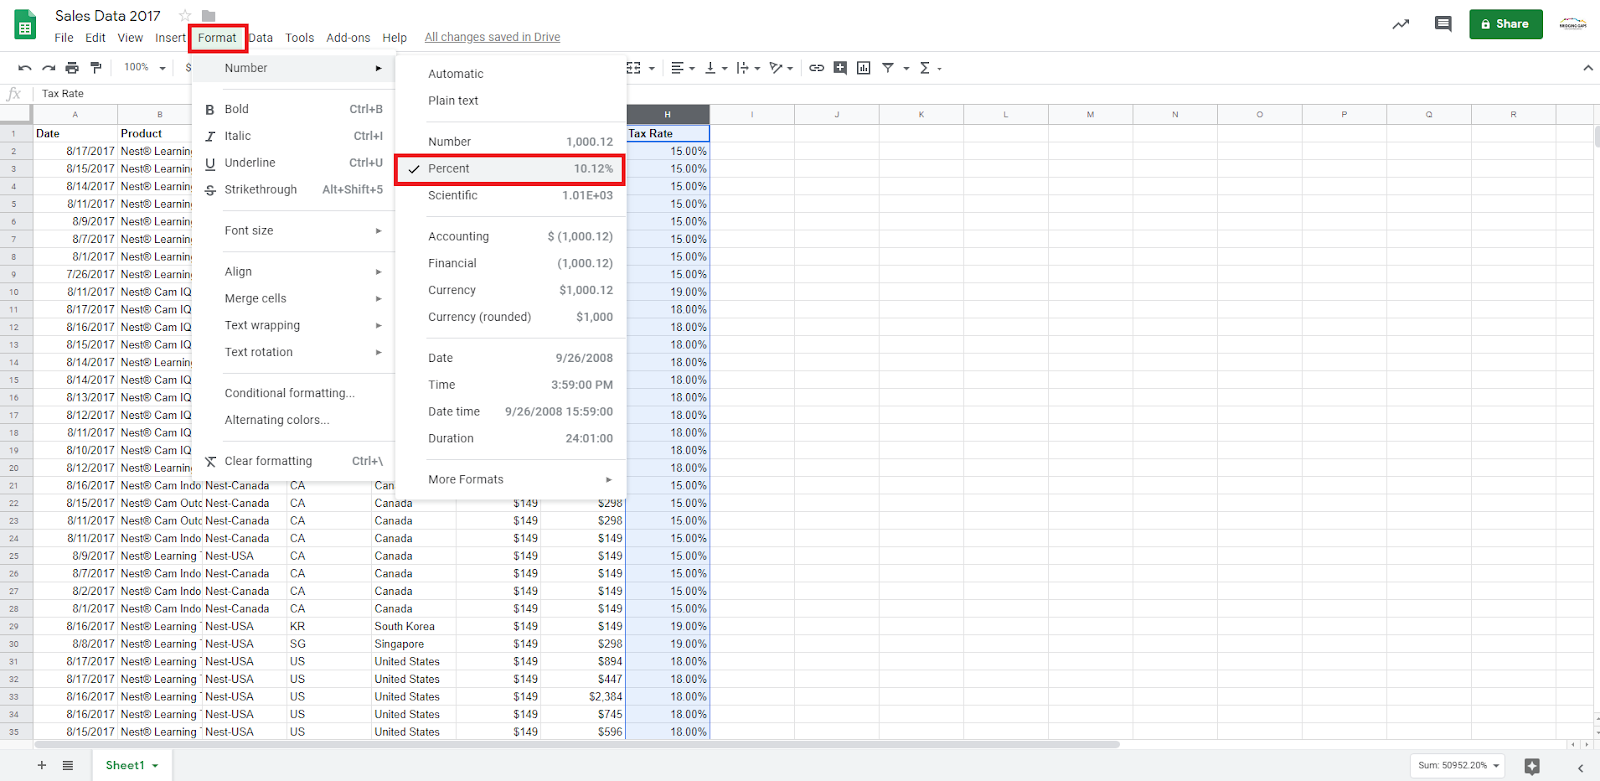
Percentage example:
5) It is important to note that Google Sheets Connector can only connect to one sheet at a time. So, it is necessary to ensure that all the information that needs to be exported to GDS is displayed in a single sheet.
6) GDS cannot import data that is displayed in charts or graphs so it is necessary to ensure that all the information in Google Sheets is presented in a table format.
7) On the table in Google Sheets, a ‘total’ row displaying the sum of each column’s data cannot be included because this will result in double counting. The sum of each column can be added in GDS if it is required.
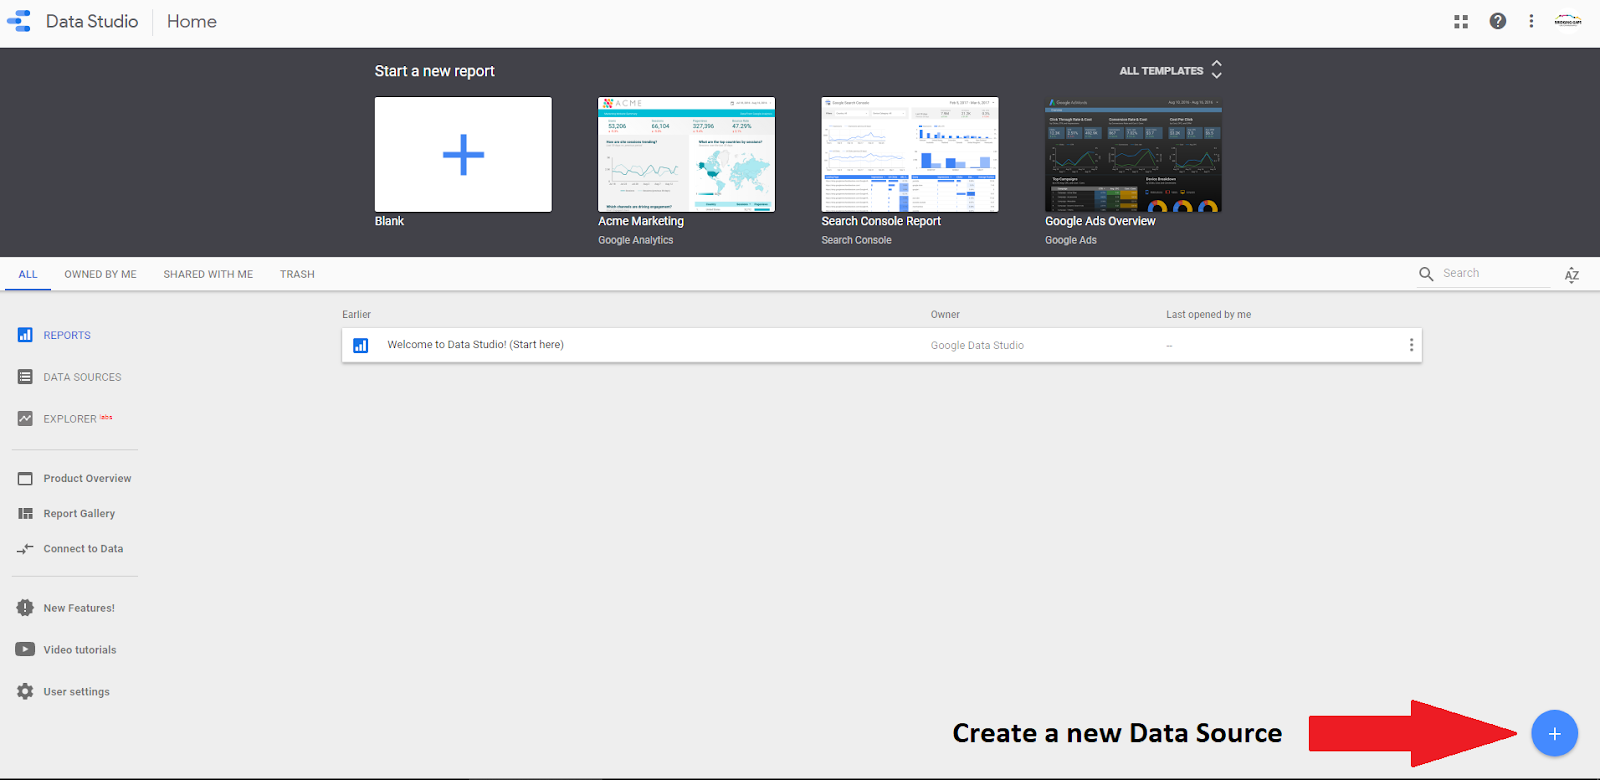
8) In order to connect Google Sheets to GDS, it is necessary to create a new data source by selecting the ‘+’ in the bottom right-hand corner of the page in GDS.
The following screen will then appear:
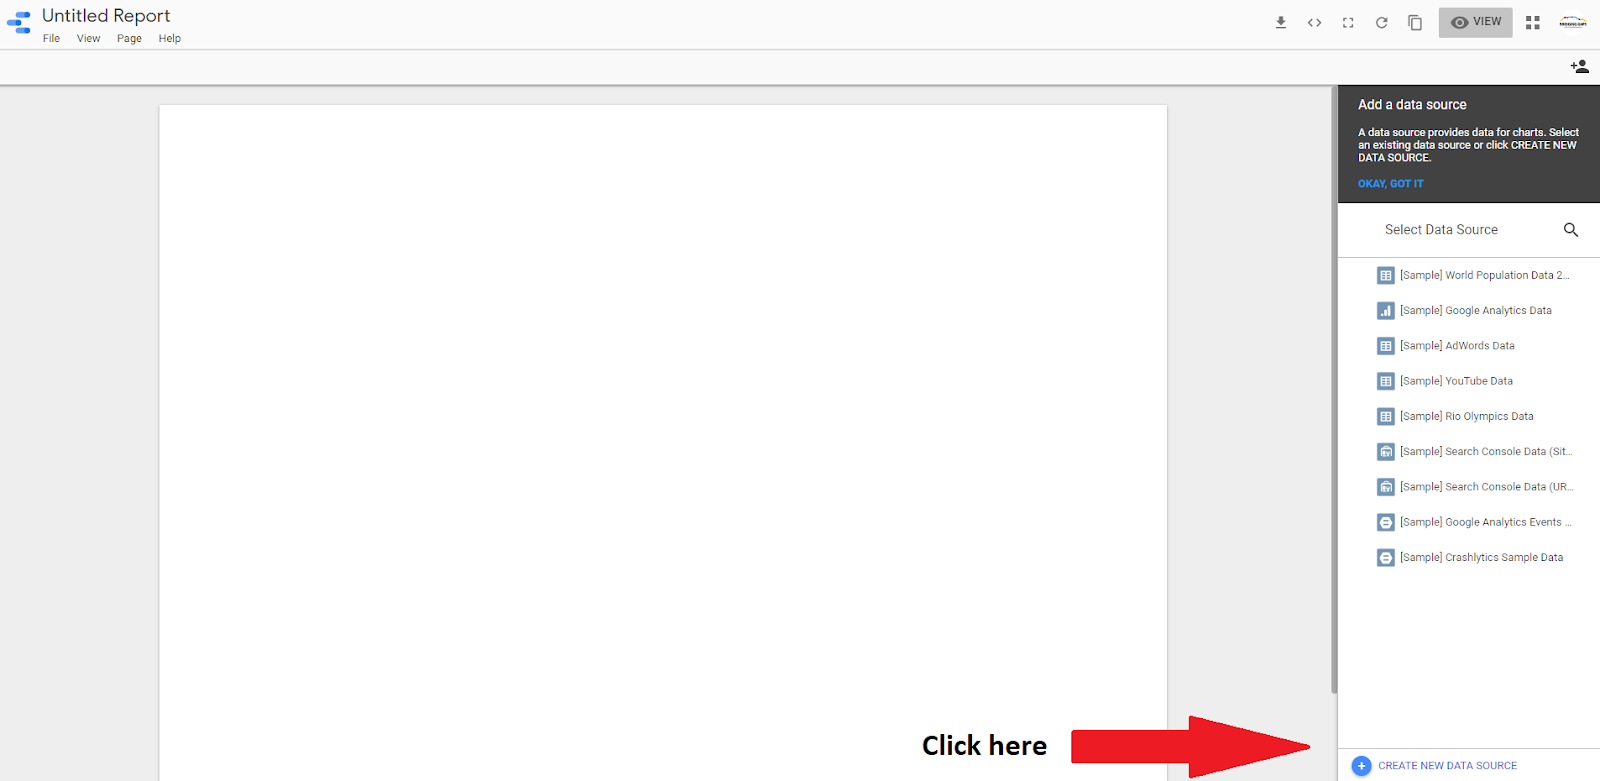
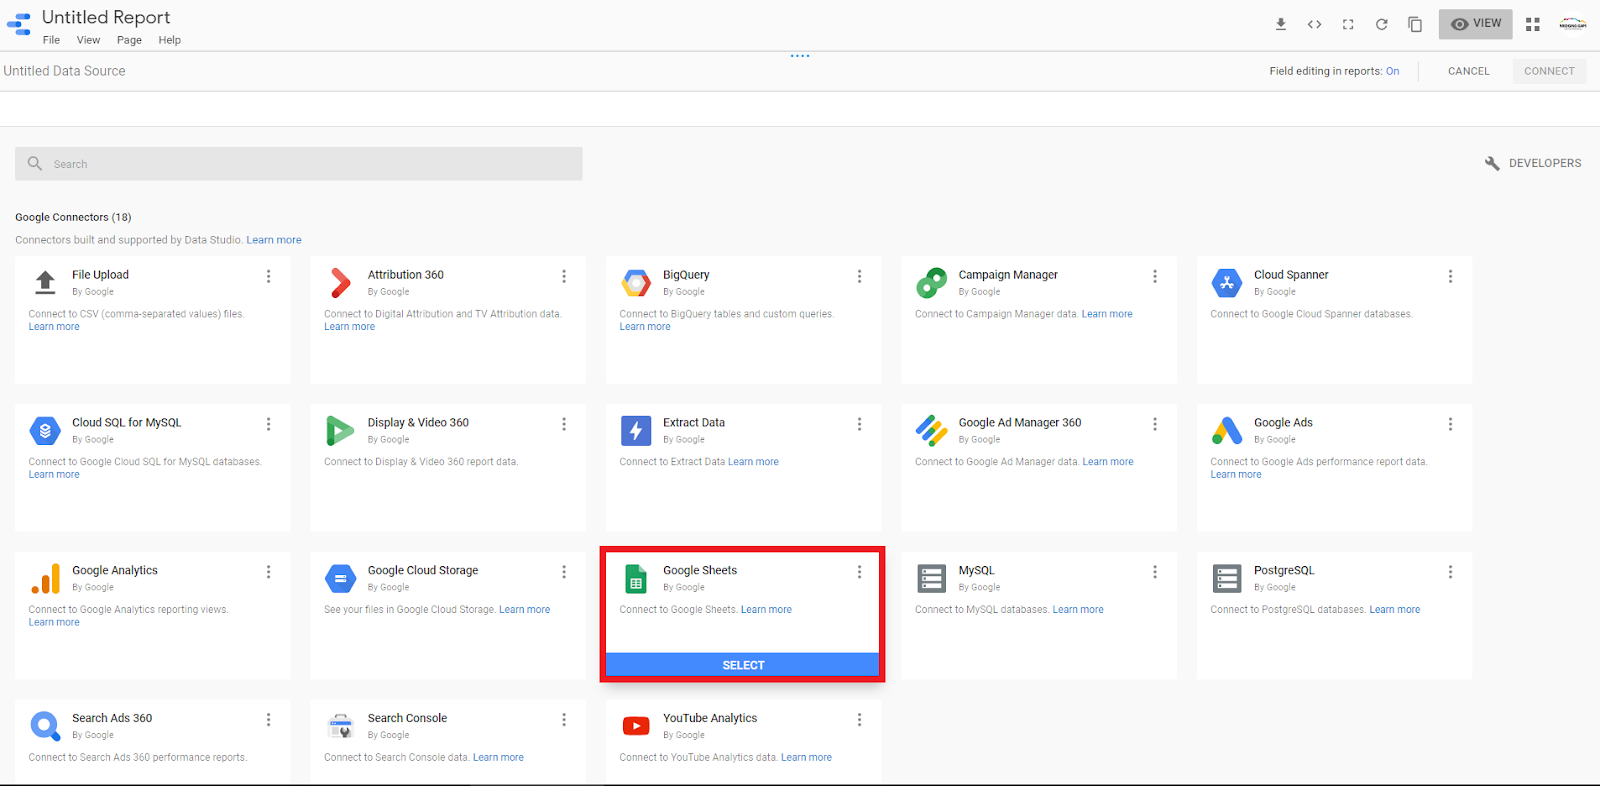
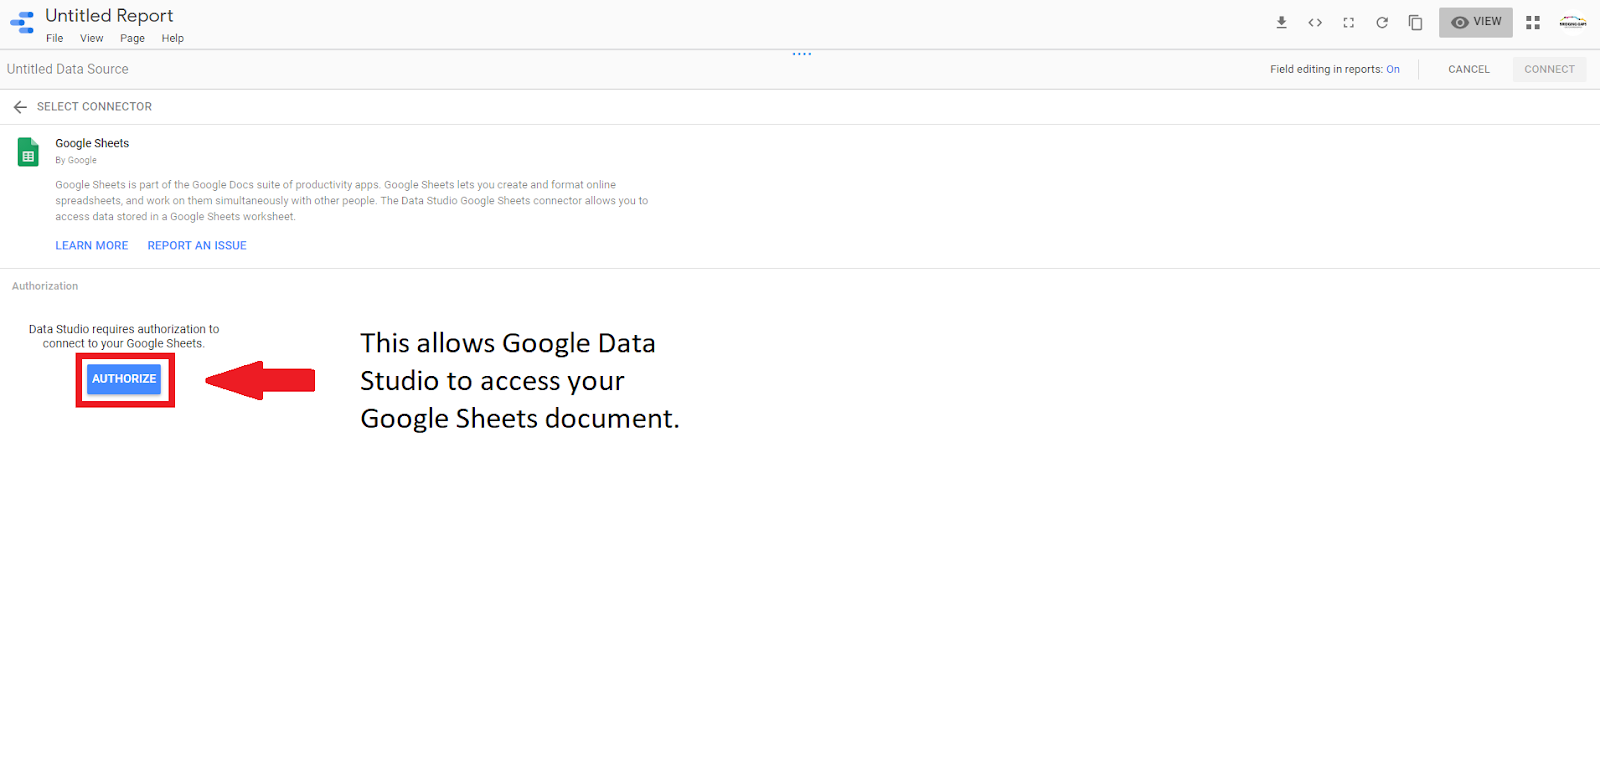
9) Next, select the Google Sheets data connector and authorize the account.
10) Once GDS is able to access the Google Drive folder where the Google Sheet is stored, it can connect to the sheet in one of three ways:
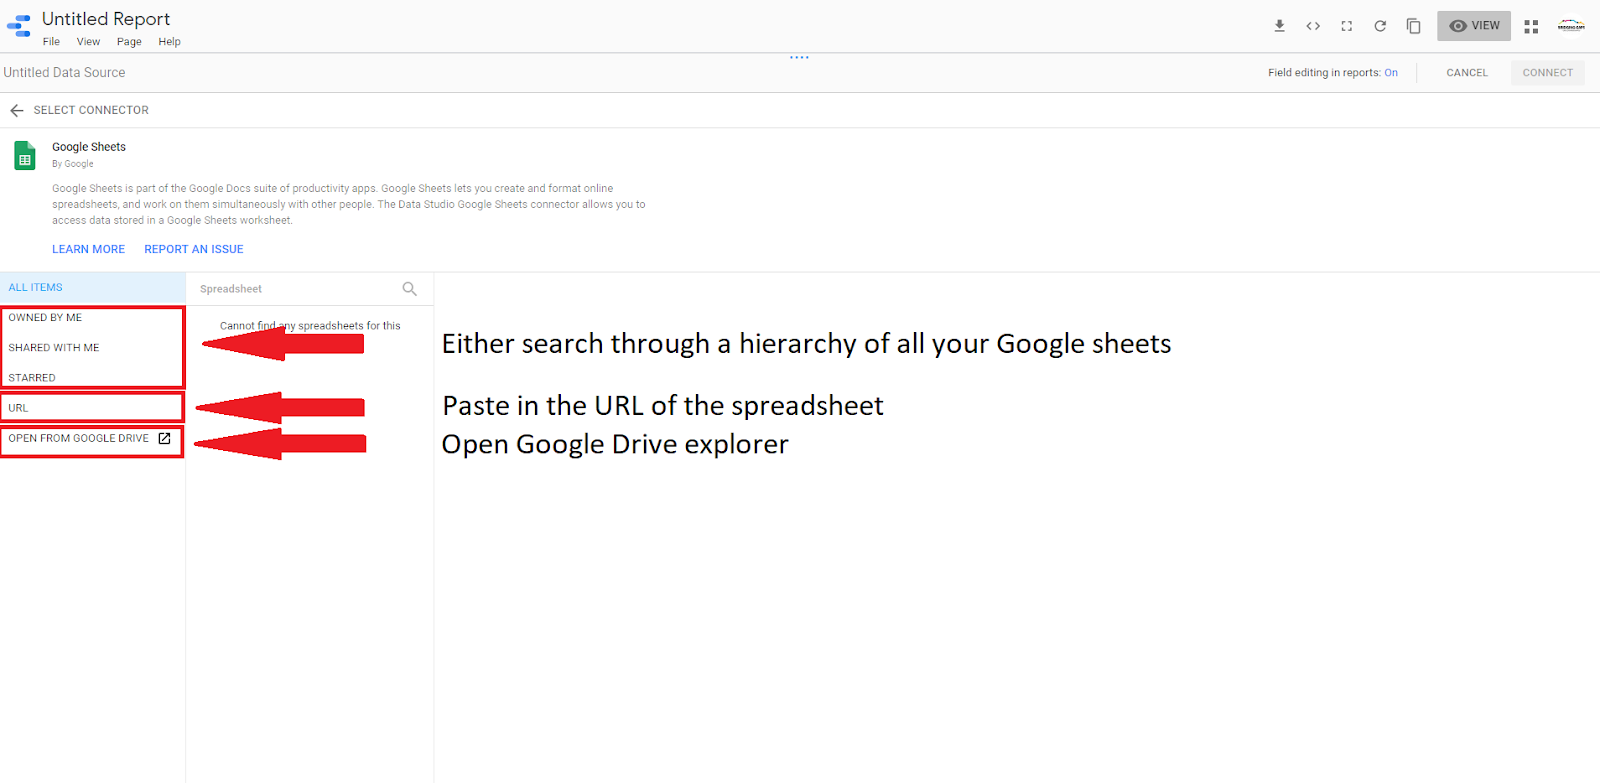
11) Select the option that best suits you. It’s important to make sure that the ‘Use first row headers’ checkbox is selected. Finally, click connect.
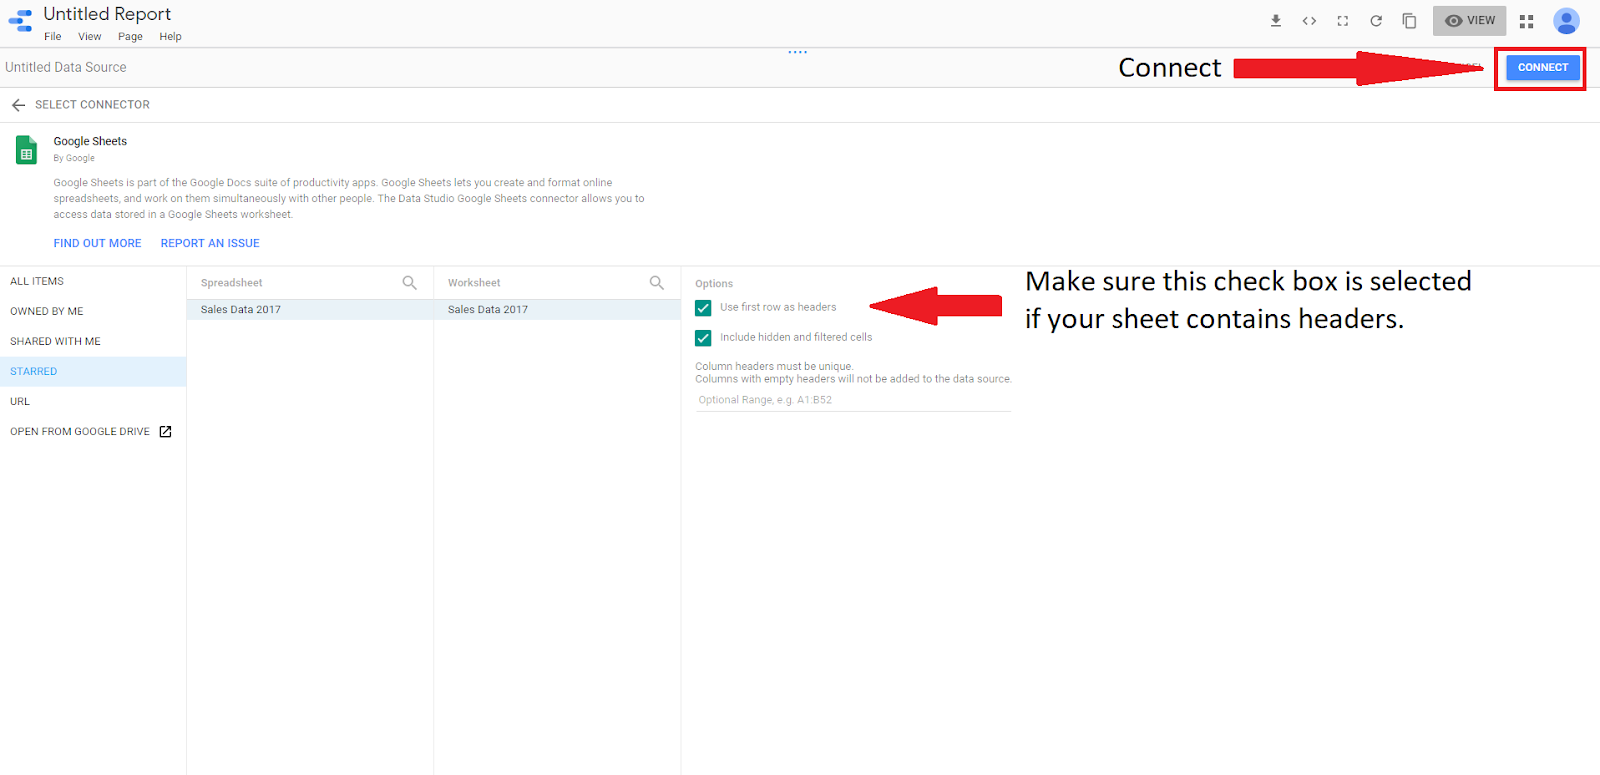
12)There are two important things to check before connecting the Google Sheet with GDS:
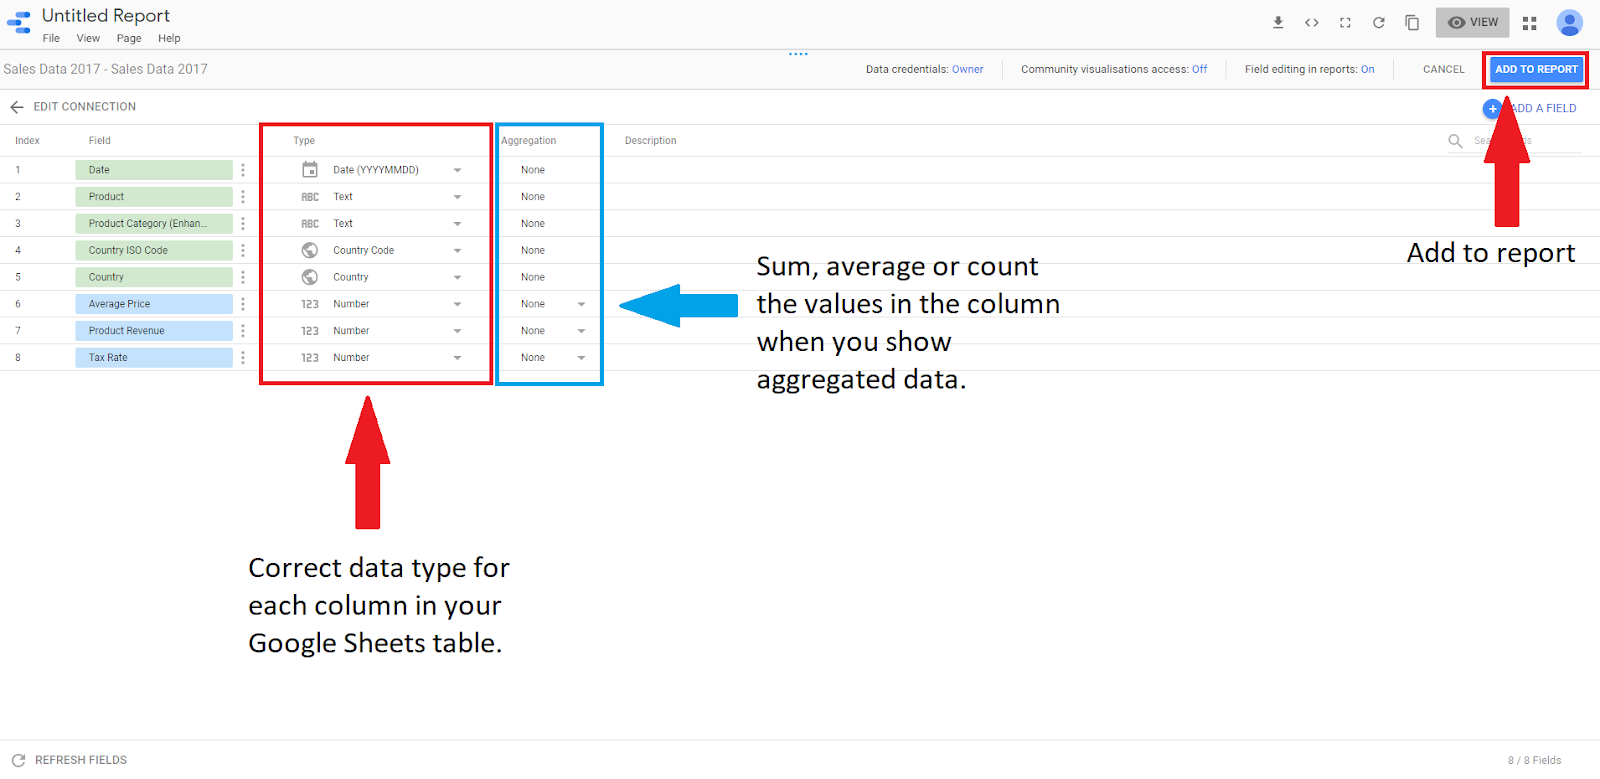
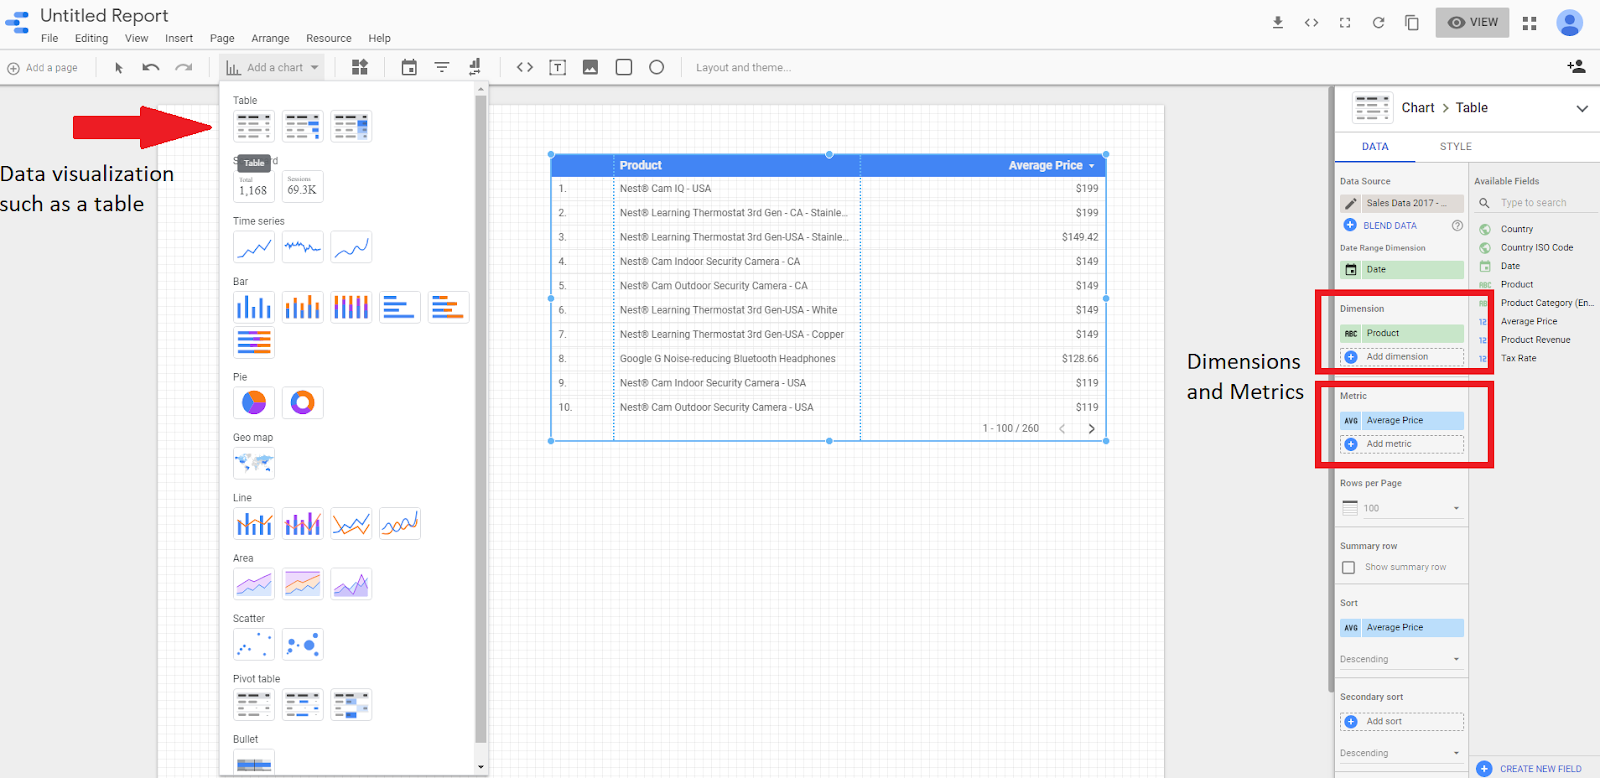
13) When you select a data visualization from the drop-down menu, you will see from the data tab that the dimensions and metrics are now available to use in your report. Add in a table to confirm that GDS is displaying the correct information with the correct data ‘types’ from Google Sheets.
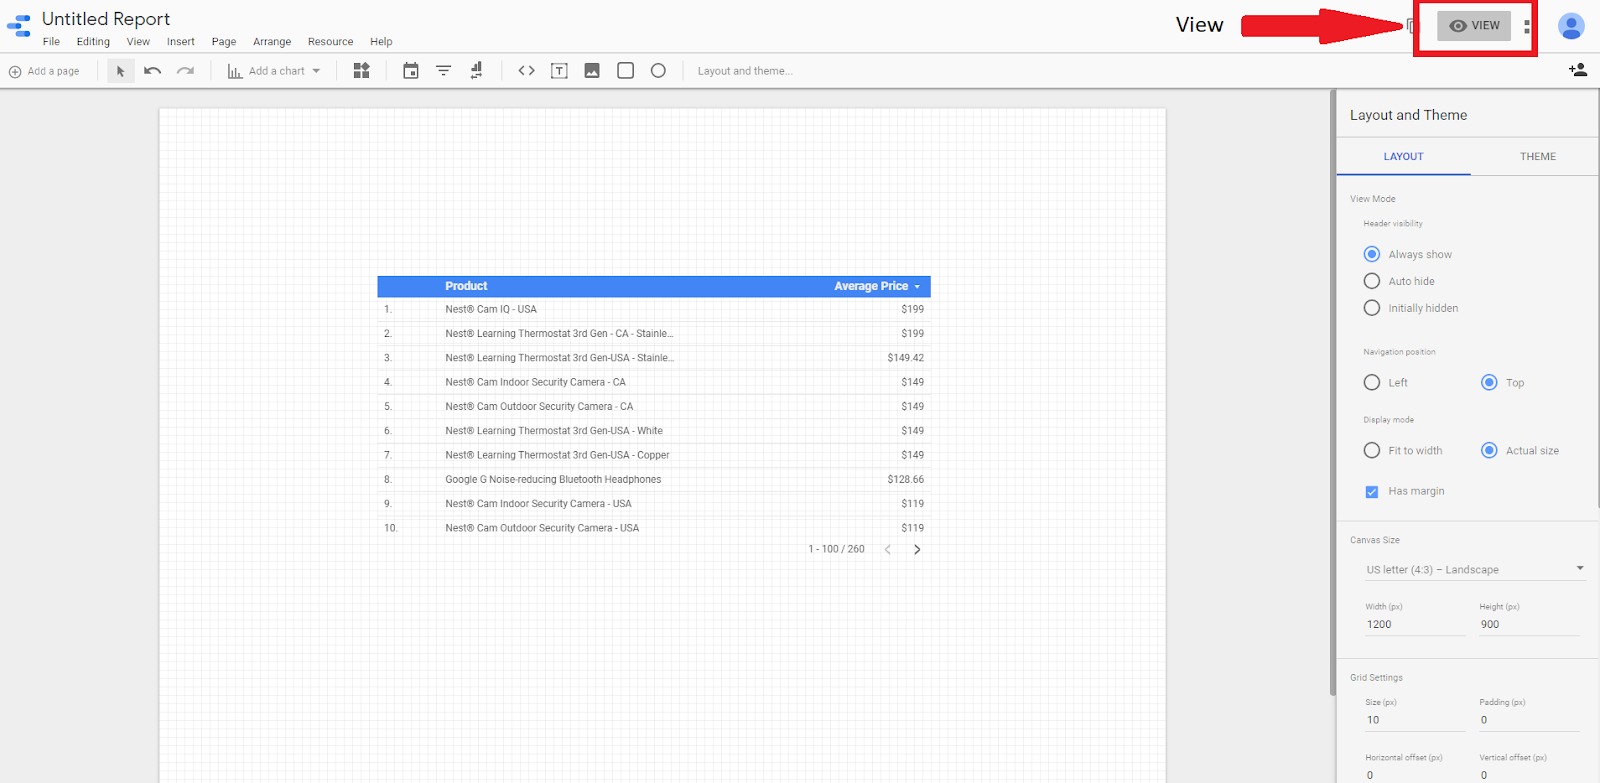
14) It is possible to build a report by following the same steps outlined in our previous articles. To see a preview of the report, select ‘view’ in the top right-hand corner of the page.
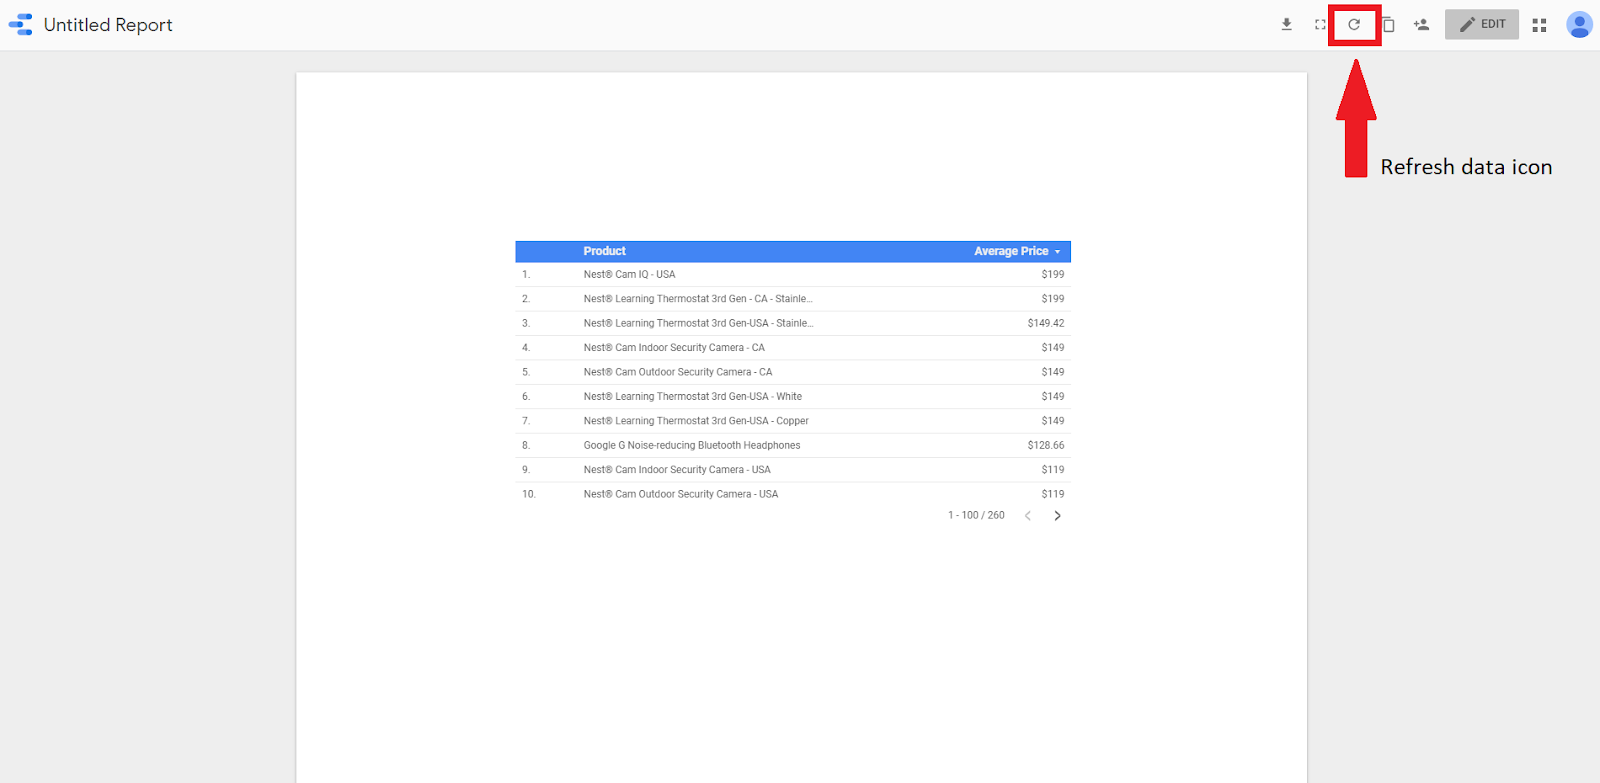
15) Finally, in order to edit any information in the GDS report, amend the Google Sheets accordingly and select the refresh button at the top of the page.
We hope this article was helpful and has assisted you in improving your knowledge in Google data studio. Don’t miss the next article in our ‘how to’ series guide.

