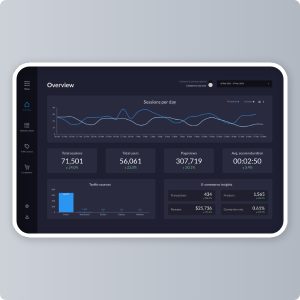
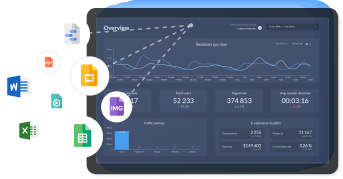
Turn your Google Analytics 4 data into an interactive dashboard that surfaces clear and actionable insights with this GA4 Looker Studio Report Template.
Whether you want to know your top users and traffic acquisition channels, e-commerce purchase funnel, where your visitors are coming from, or what they do once they land, this dashboard delivers.
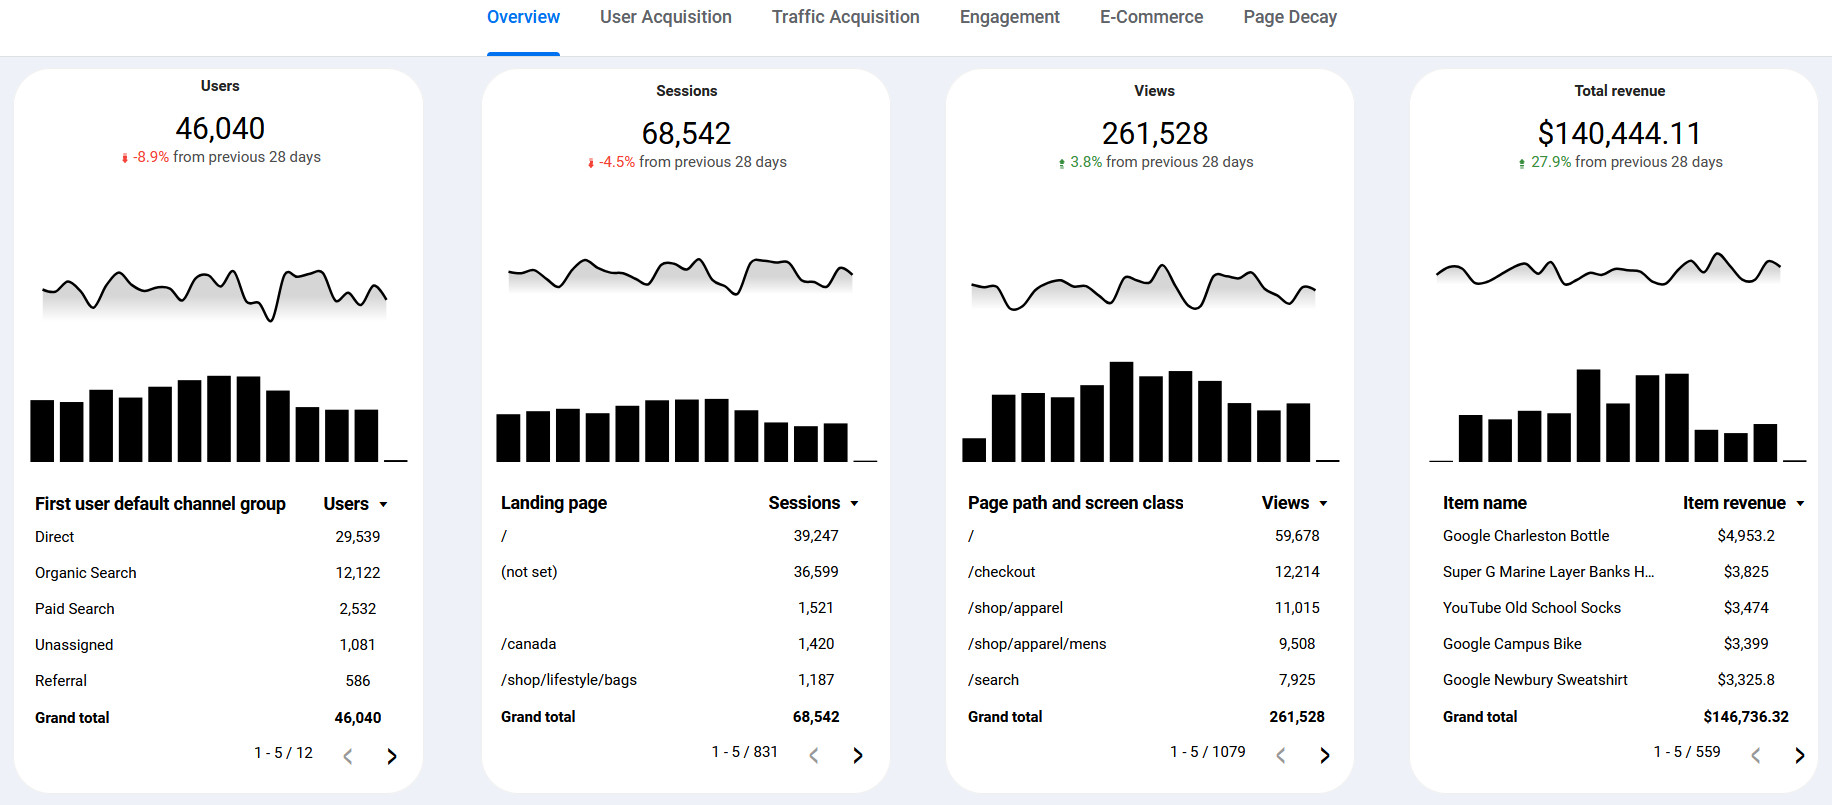
It gives you a complete picture of your website’s performance.
See the Template in Action (Demo it)
Insight You Will Gain Instantly from the GA4 Dashboard
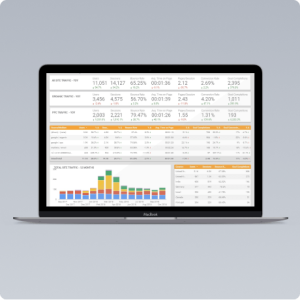
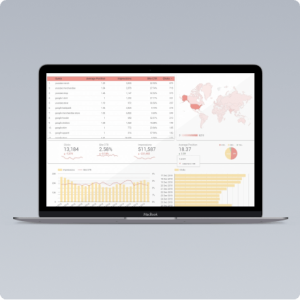
User Acquisition
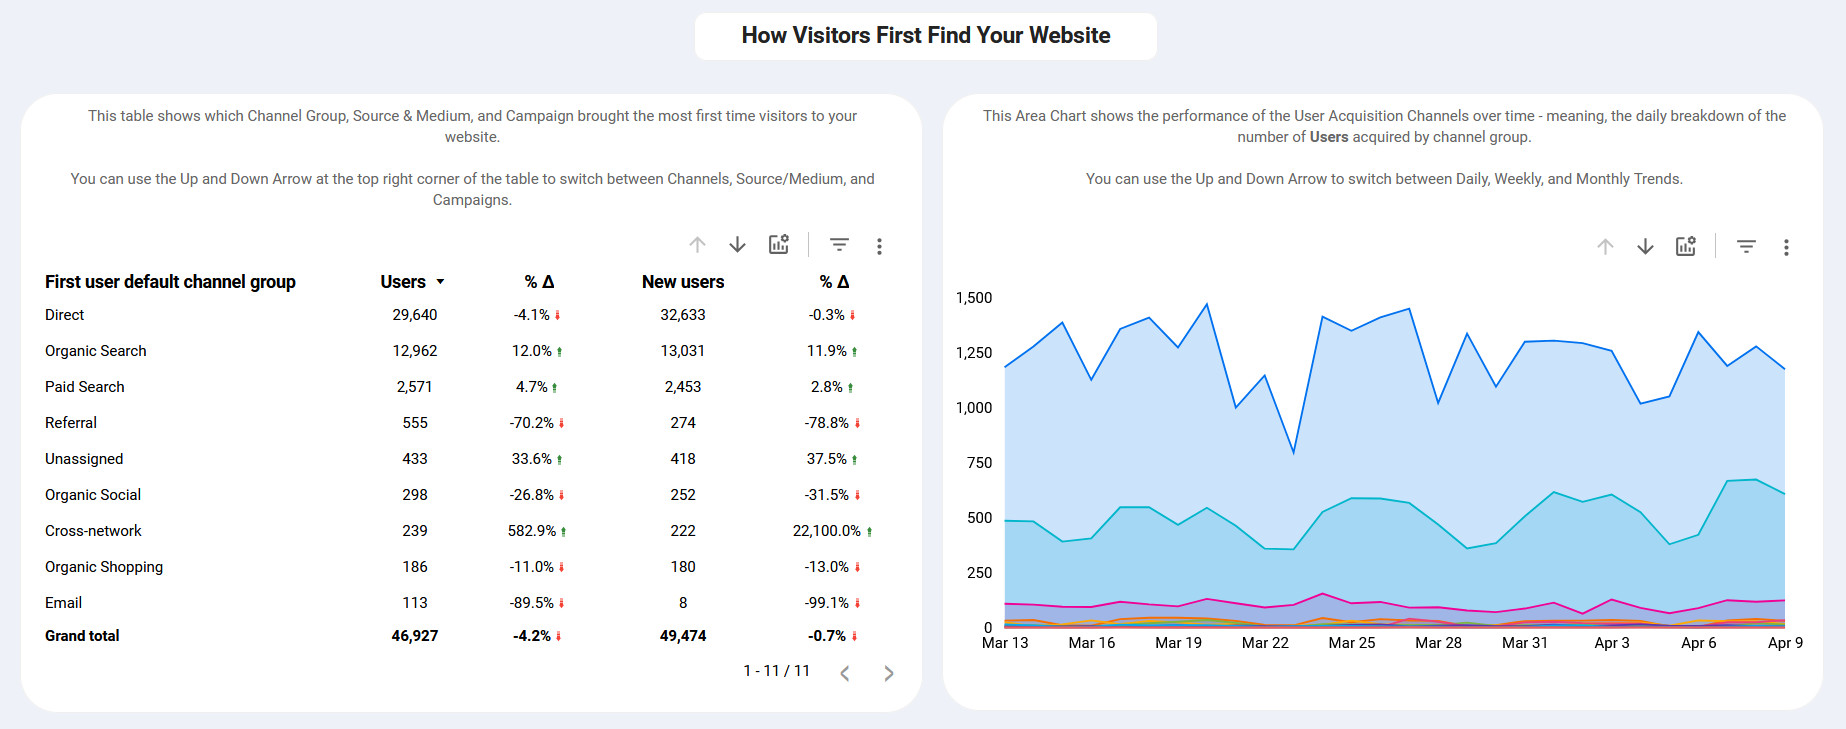
- How are users first finding your website (Channels, Source/Medium, and Campaigns)? Has it changed from the selected date range to the previous period?
- Can I see the daily, weekly, and monthly trends of user acquisition?
- How many of the users in this date range are New Users?
- How are these Users engaging with your website? (Sessions per User, Engagement Rate, Average Engagement Time per Session)
- Where are these users located, what devices do they use, and who are they demographically (Age Group and Gender – If available for your GA4 account)?
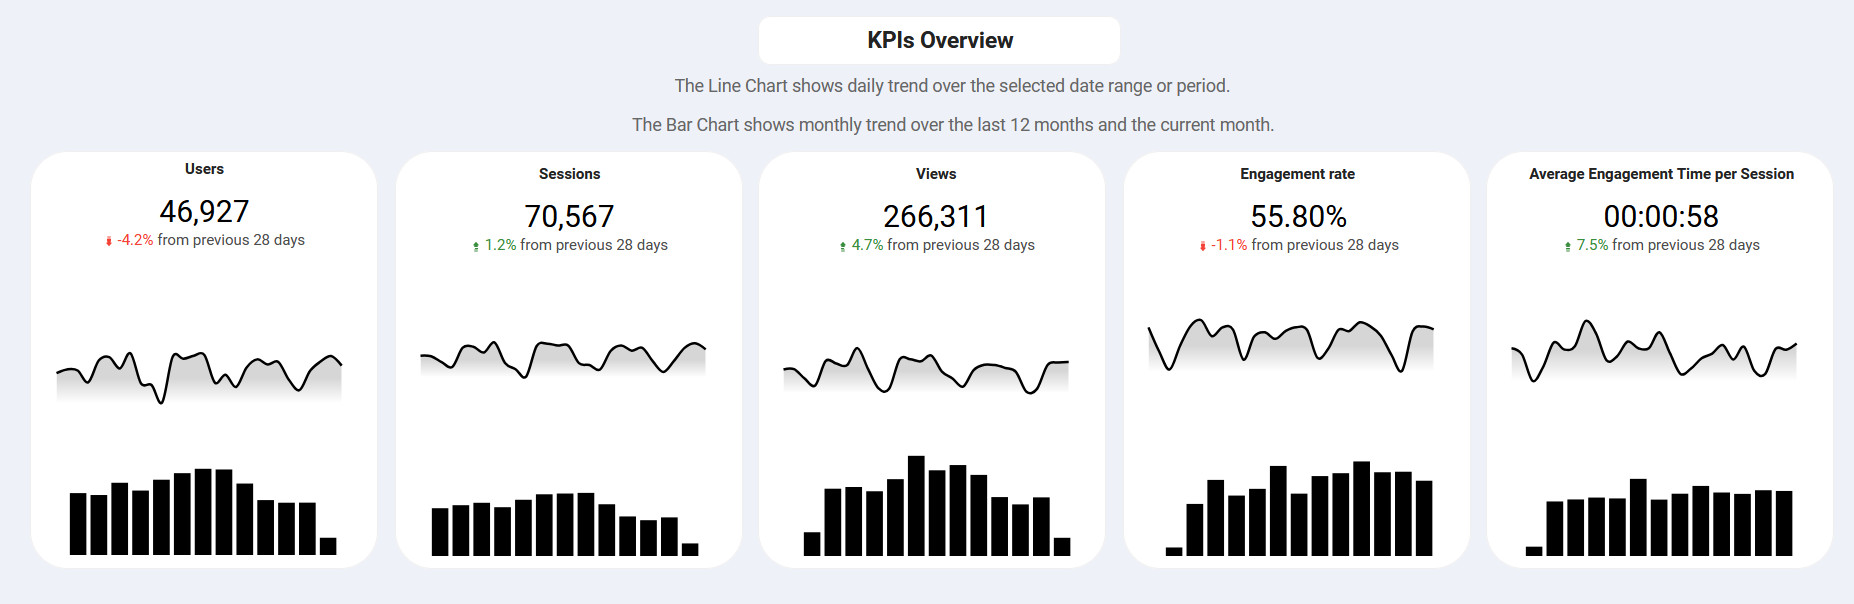
- What does the last 12 months look like for each KPI?
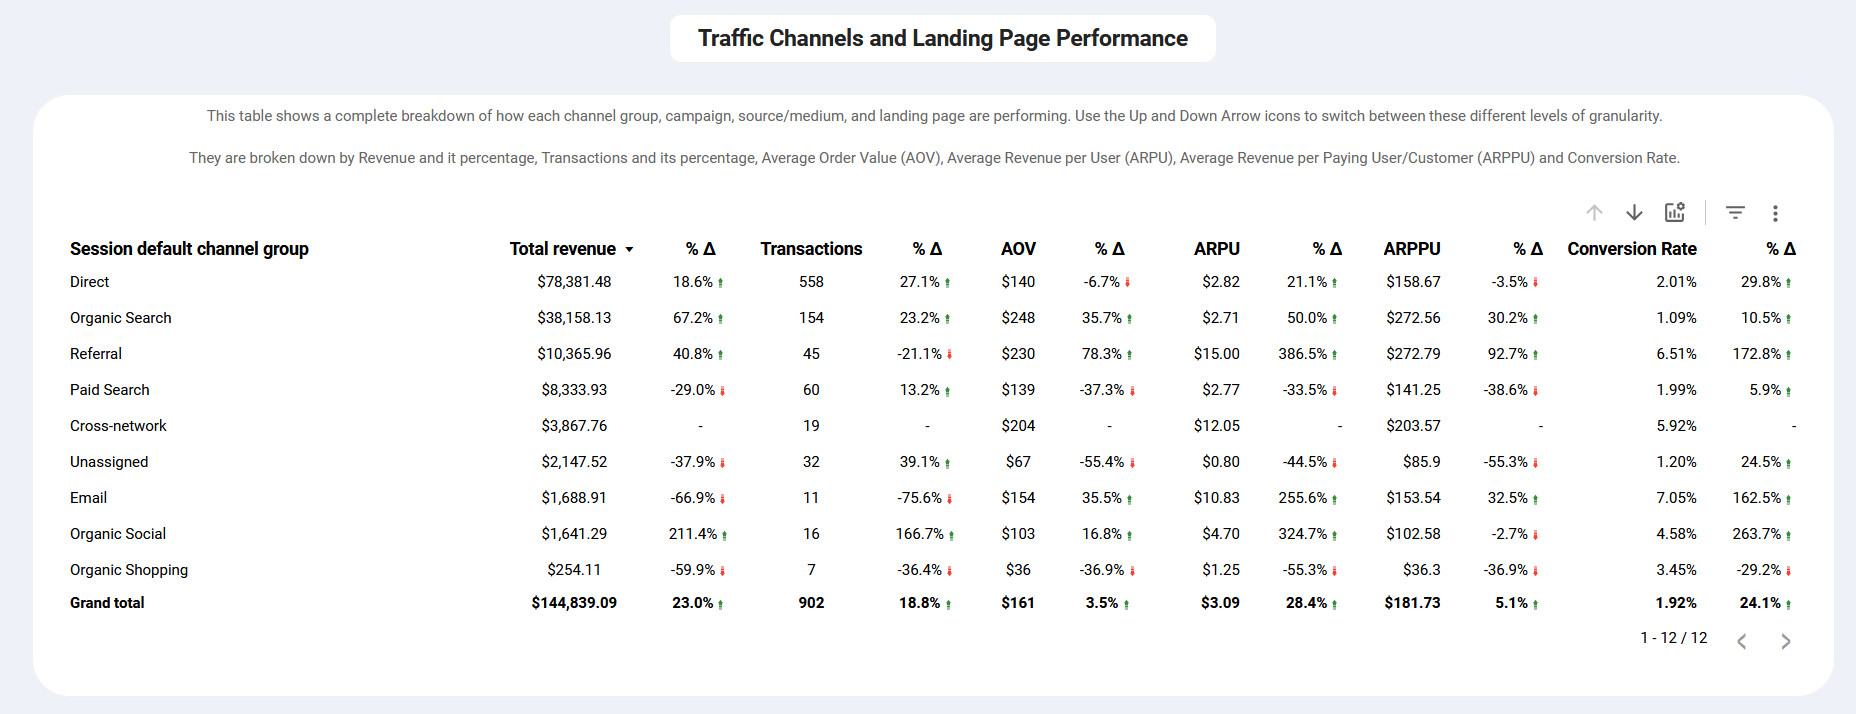
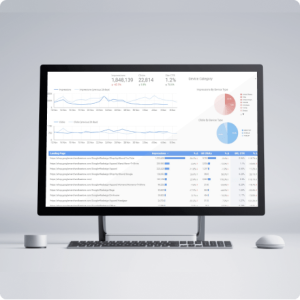
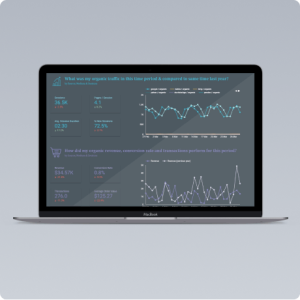
Traffic Acquisition
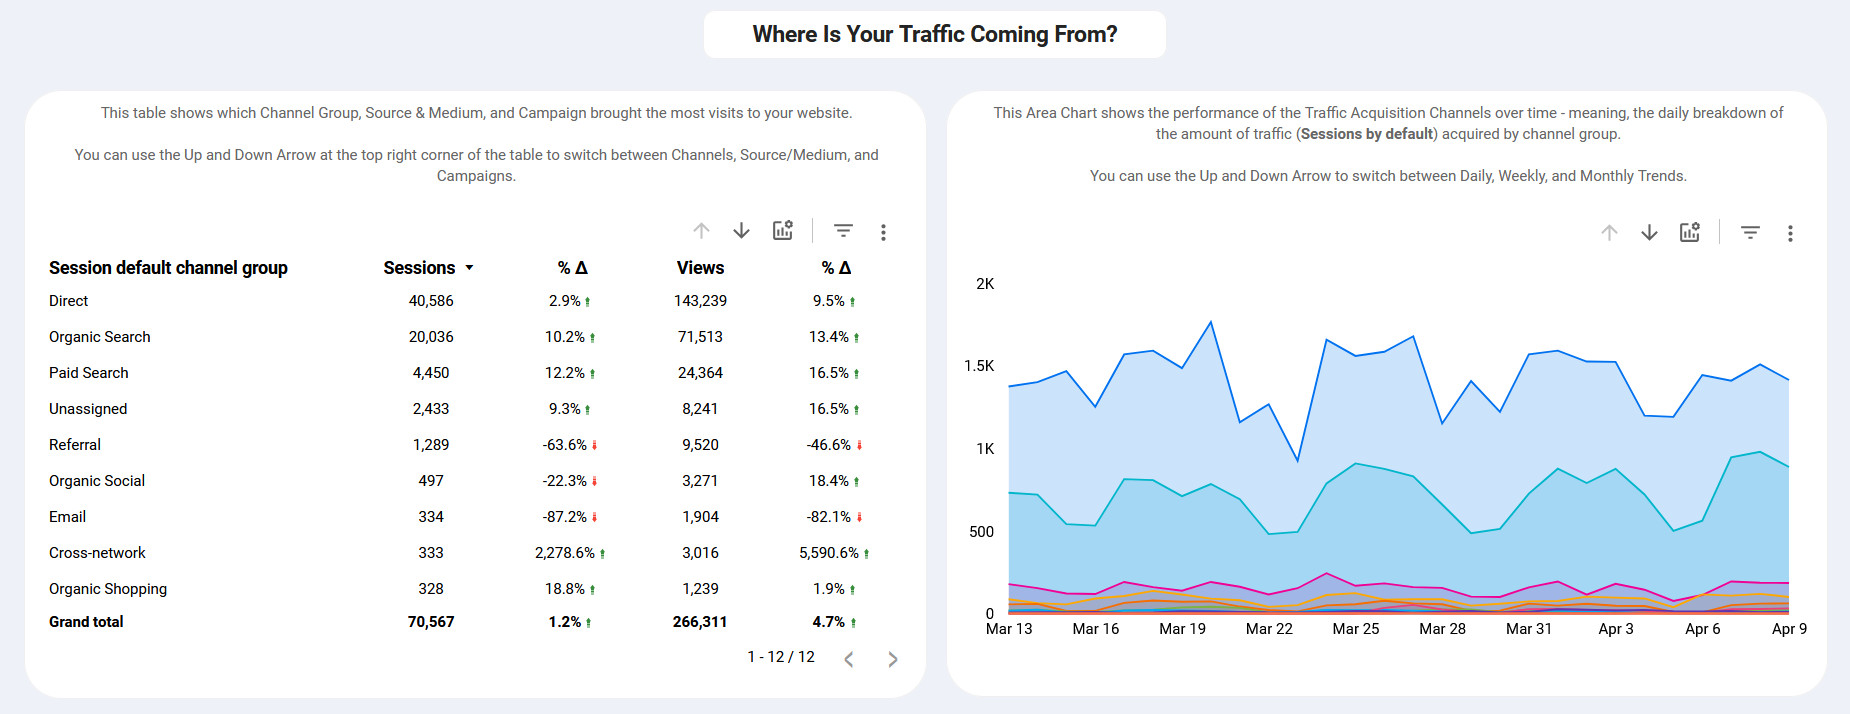
- Which Channels, Source/Medium, and Campaign are sending traffic to your website? What does the change look like period over period?
- What is the daily, weekly, and monthly traffic breakdown for each Channel, Source/Medium, and Campaign?
- What are Sessions and Views like for the selected period, and how does it compare to the previous period? What does the past 12 months look like?
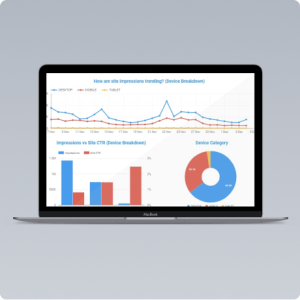
- What device types, gender, countries, and age groups are your traffic coming from?
Engagement & Content
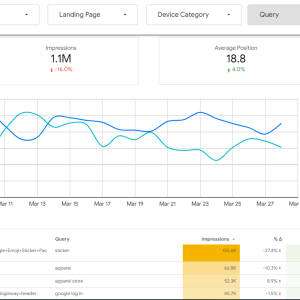
- Which pages get the most Views, and how does it compare to the previous period?
- What are your top landing pages, and how are they performing compared to the previous period?
- What are the behavioral patterns across audience segments?
- Which hour of the day and day of the week do we receive the most Users, Traffic, Orders, and revenue?
E-Commerce Performance
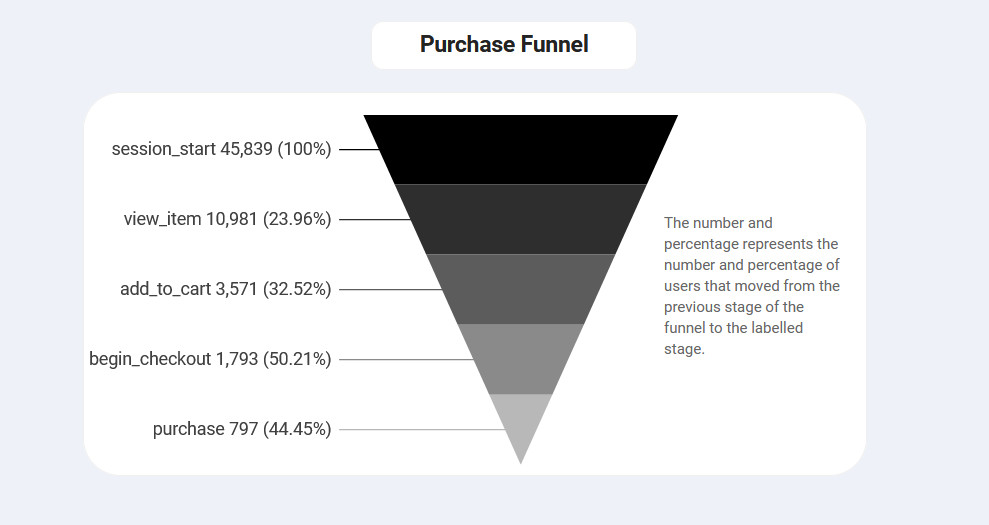
- How many users and orders (transactions) do we have for the selected date range?
- What’s the revenue, AOV, and ARPU?
- Where are users dropping off in the purchase funnel?
- What are your top-performing products and product categories?
- How are KPIs performing over the last 12 months?
- Which Channel, Source/Medium, Landing Page has the highest conversion rate, Average Order Value (AOV), and Average Revenue per User (ARPU)?
Page Decay Analysis
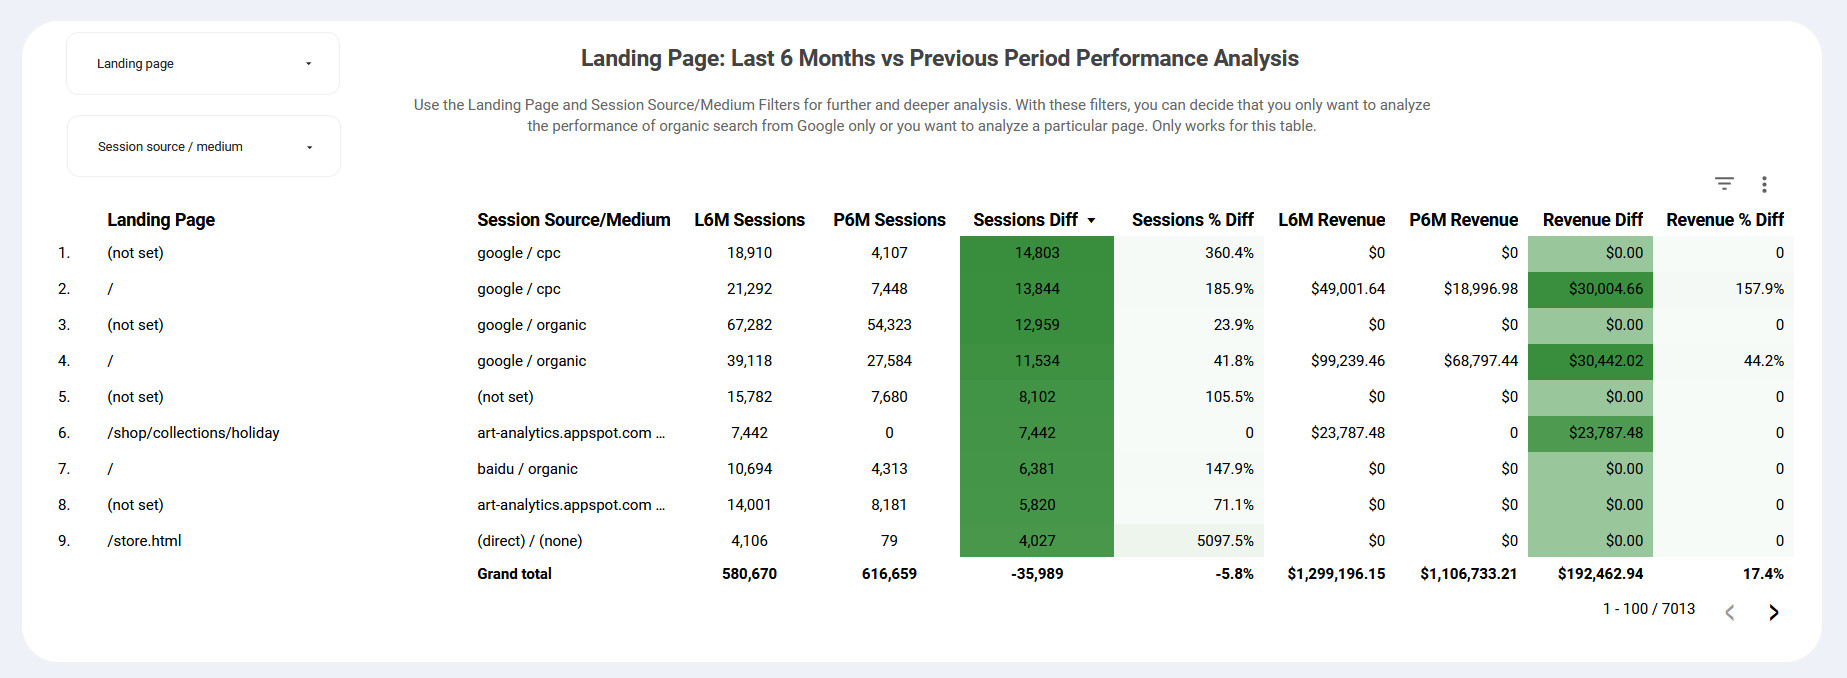
- How are your Pages and Traffic Channels performing over the last 6 months, and what is the difference and percentage difference compared to the previous 6 months?
Who Is This Google Analytics 4 Report Template for?
- Digital Marketers who want to tie performance to traffic sources.
- E-Commerce Managers who want to track revenue drivers at a glance.
- SEO Specialist tracking organic traffic and page performance.
- Business Owners who just want clarity.
How to Copy the Template
Once you have bought the template;
Open the Looker Studio link you received.
- Click on the 3-dot vertical menu at the top right corner of the dashboard
- Click on Make a Copy
- Under “New Data Source”, select your GA4 account
- Then, click on Copy Report.
Frequently Asked Questions
Q: What do I need to use this dashboard?
A: Just a Google Analytics 4 property and access to Looker Studio (free with a Google account). No technical setup is required – I attached a setup video to the message you get after purchase.
Q: Will this work with any website?
A: Yes! As long as your website is tracking data with GA4, this dashboard will work.
Q: Do I need to give you access to my GA4 account?
A: No. We will never ask for your credentials.
Just follow the setup video to copy the dashboard.
Q: Can this be customized for my business?
A: Absolutely. The dashboard works out of the box, but you can customize it to align with your specific metrics, goals, or branding.
Q: How often does the data update?
A: The dashboard pulls data directly from the GA4 API. So, you get updates as GA4 gets them.
Q: What if I’m not familiar with Looker Studio?
A: No worries. The dashboard was set up with this in mind.
There are notes on charts and tables, when and where needed, to guide users on how to use them.
Also, feel free to reach out to me if you have any questions.
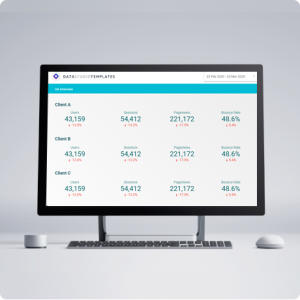
Q: Can I Copy for all my Clients?
A: Absolutely, you can copy it as many times as you want for your clients. However, you are not allowed to resell it online as your own.
Q: Is there a Refund?
A: No.
Kindly use the Demo link above, and use your data source (any GA4 account that your Gmail account has access to) to see what the template has to offer you.


Reviews
There are no reviews yet.