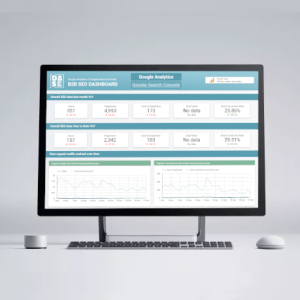
Template to analyze the evolution of traffic from AI sources (Chatgpt, Perplexity, Claude, Gemini, Copilot…), see the impact at organic level with data from Google Search Console and be able to analyze the keywords and pages that have lost or gained clicks and CTR since the advent of AI Overviews/AI mode.
It has data from Google Analytics 4 and Google Search Console. Includes tutorial to connect the data sources (very simple) and to modify the filters according to the reference sources.
Report pages:
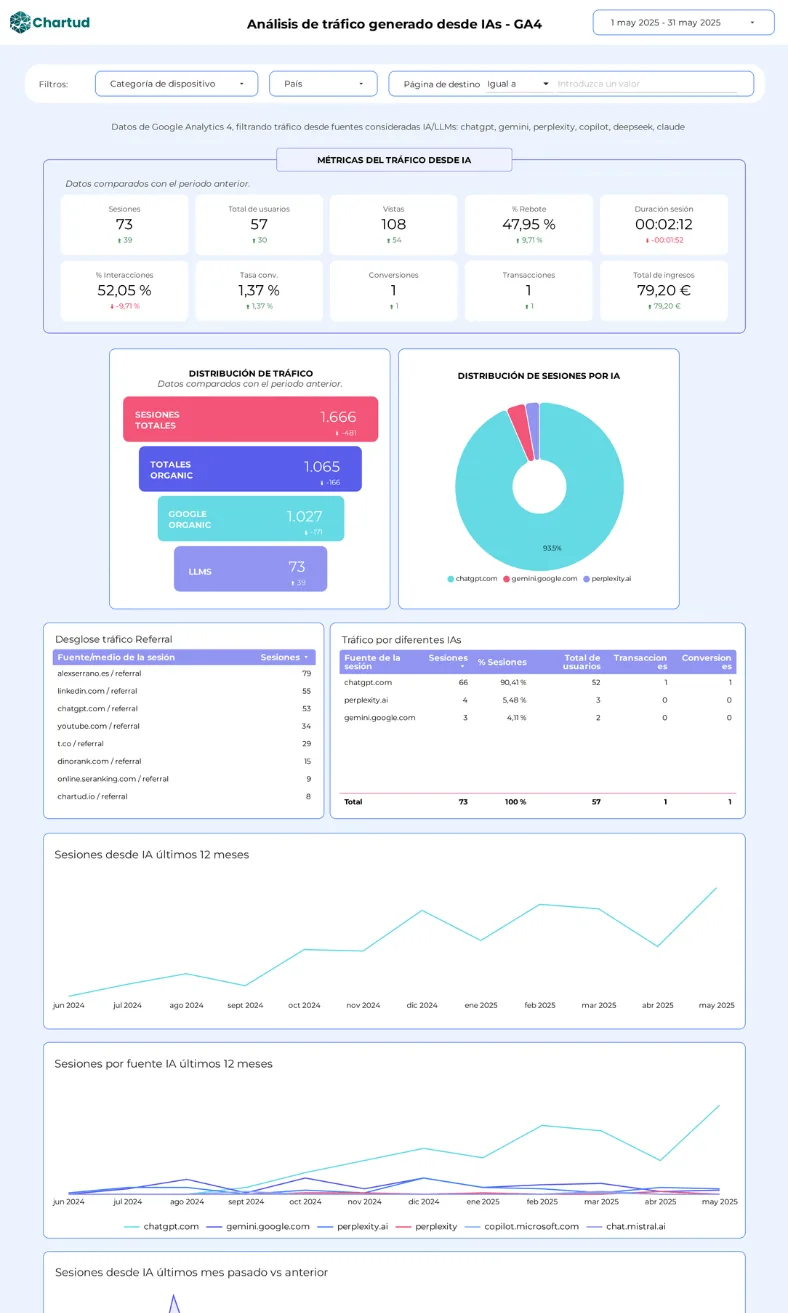
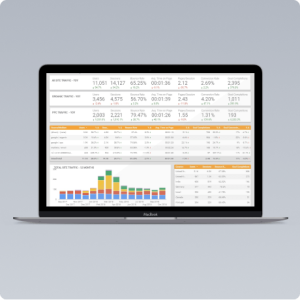
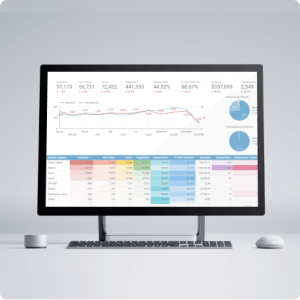
Page 1: Analysis of traffic generated from IAs – GA4
With this page you will know the traffic coming from IAs, as well as understand how that traffic behaves and if it generates a quality visit. You can also analyze the evolution of traffic from IAs and see it by each of the sources (ChatGPT, Gemini, Perplexity, etc). It has filters by device category, country and landing page.
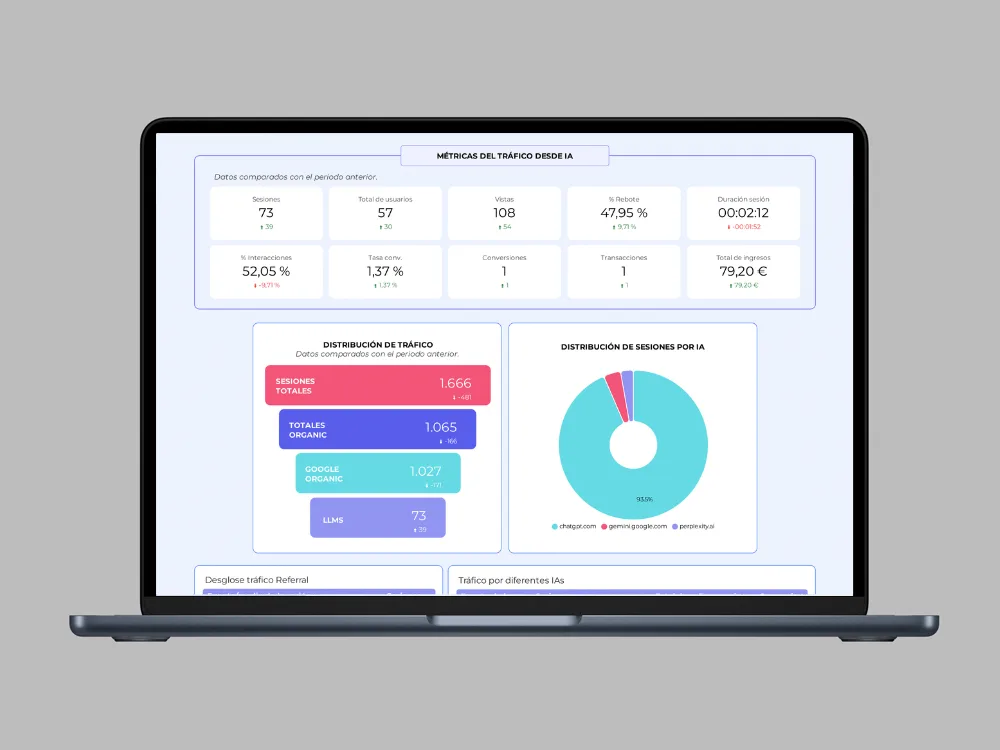
-Metrics filtered by source corresponding to IAs/LLMs: sessions, total users, views, % bounce, session duration, % interactions, conversion rate, conversions, transactions and revenue.
-Traffic distribution funnel: total sessions > total organic > Google organic > LLMs
-Distribution of sessions by IA
-Breakdown of referral traffic and detail of each AI
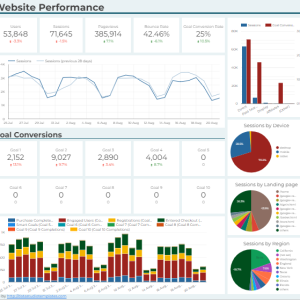
-Session evolution since IA last 12 months
-Sessions evolution by IA source last 12 months
-Evolution of IA sessions last month vs. previous month
-Distribution of sessions and conversions by IA source.
-Most visited page from IA and breakdown with the specific IA source.
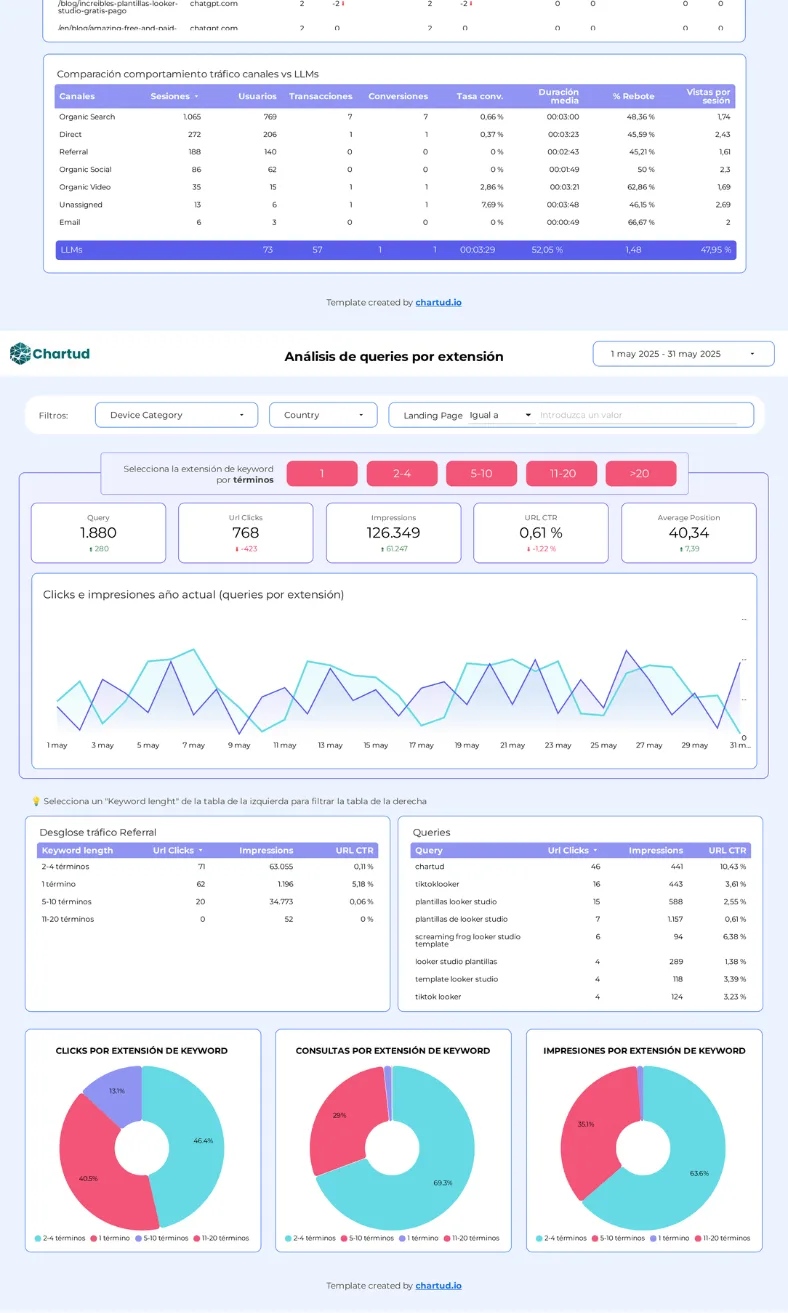
-Comparison of visit quality of all channels vs. LLMs as a whole
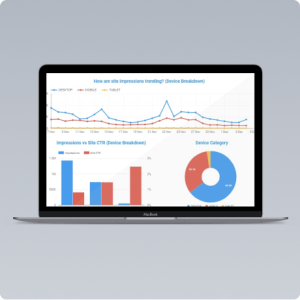
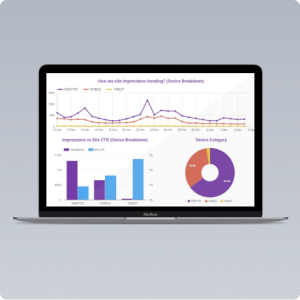
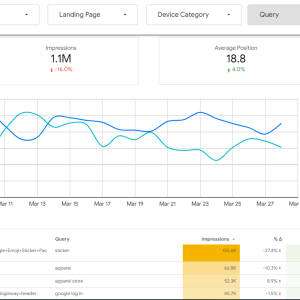
Page 2:Query analysis by extension – Google Search Console
With this page you can track the evolution of clicks, impressions and CTR since the advent of IA Overviews, separating the analysis into queries of 1 term, 2-4, 5-10, 11-20 and more than 20 terms. This page has filters by device category, country and landing page.
-Metrics: queries, clicks, impressions, CTR and average position.
-Current year evolution of clicks and impressions
This group has filters to view data for each extension.
-Grouped tables:
Table 1: Distribution of clicks, impressions and CTR by keyword extension
Table 2: detail of queries with clicks, impressions and CTR
(By clicking on a keyword group by extension in table 1 you will see the detail in table 2)
-Pie charts:
Clicks per keyword extension
Queries by keyword extension
Impressions per keyword extension
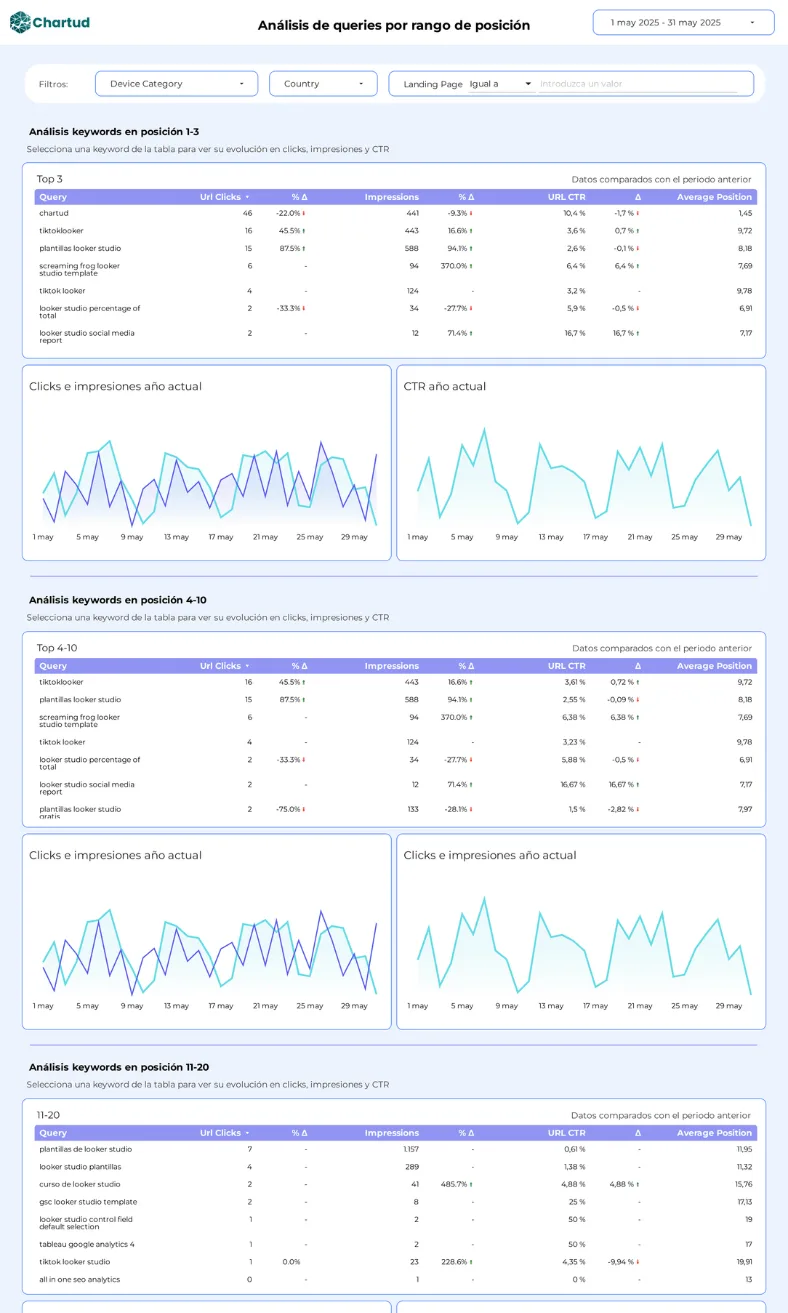
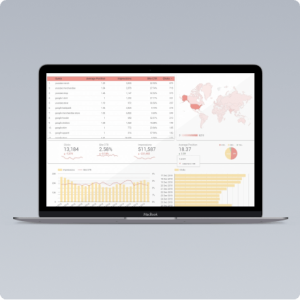
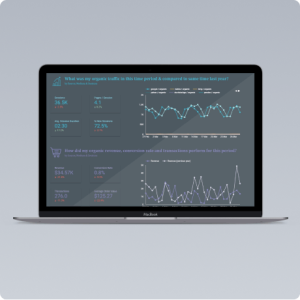
Page 3: Query analysis by position – Google Search Console
On this page you can analyze keywords by Top 3, Top 4-10 and Top 11-20 positions and check the impact that AI has on them. This page has filters by device category, country and landing page.
Group 1: Top 3 keyword analysis
-Table with details of queries. Clicks, impressions, CTR and average position.
-Clicks and impressions evolution current year
-CTR evolution current year
(Select a keyword from the table and you will see the evolution of that keyword)
Group 2: Keyword analysis in 4-10
-Table with details of queries. Clicks, impressions, CTR and average position.
-Clicks and impressions evolution current year
-CTR evolution current year
(Select a keyword from the table and you will see the evolution of that keyword)
Group 3: Keyword analysis in 11-20
-Table with details of queries. Clicks, impressions, CTR and average position.
-Clicks and impressions evolution current year
-CTR evolution current year
(Select a keyword from the table and you will see the evolution of that keyword)
👉This template can be used for different websites, projects or clients.
👉 Simply connect your GA4 and GSC account and start analyzing.


Reviews
There are no reviews yet.