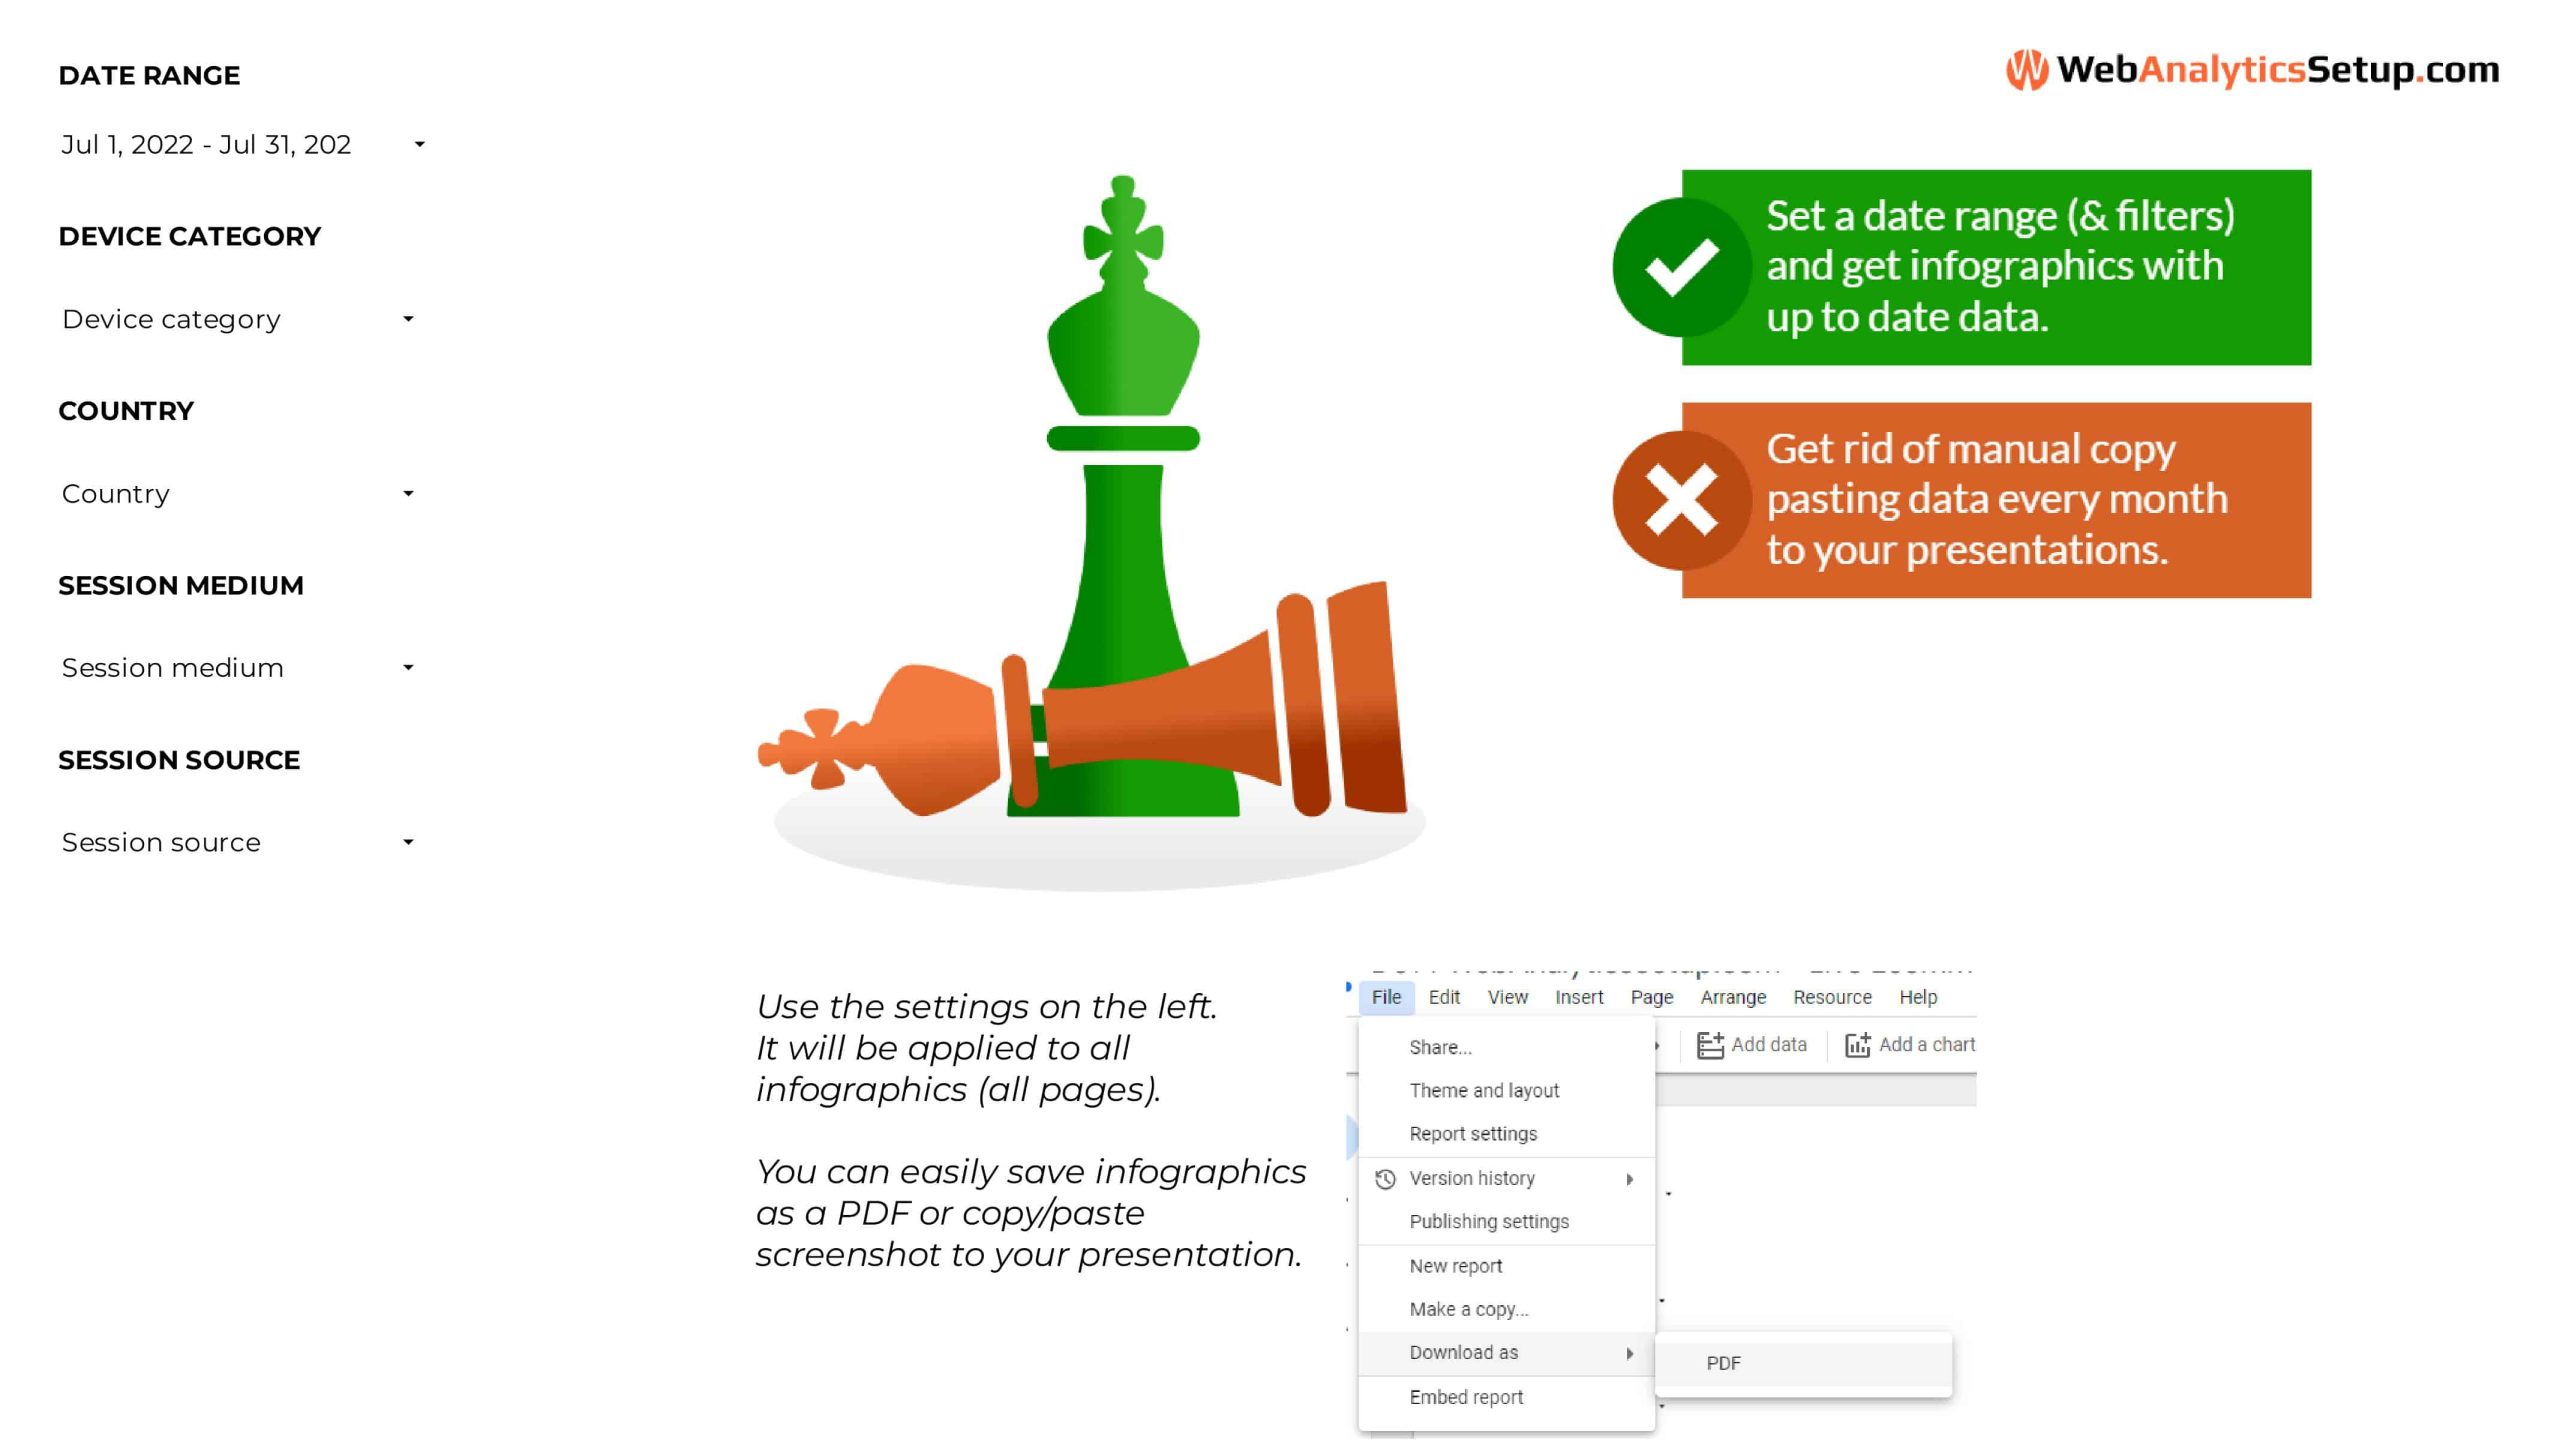
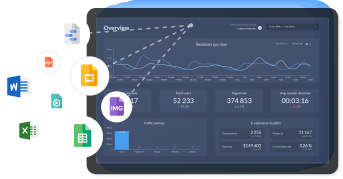
Get rid of manual copy pasting numbers to your presentations or infographics.

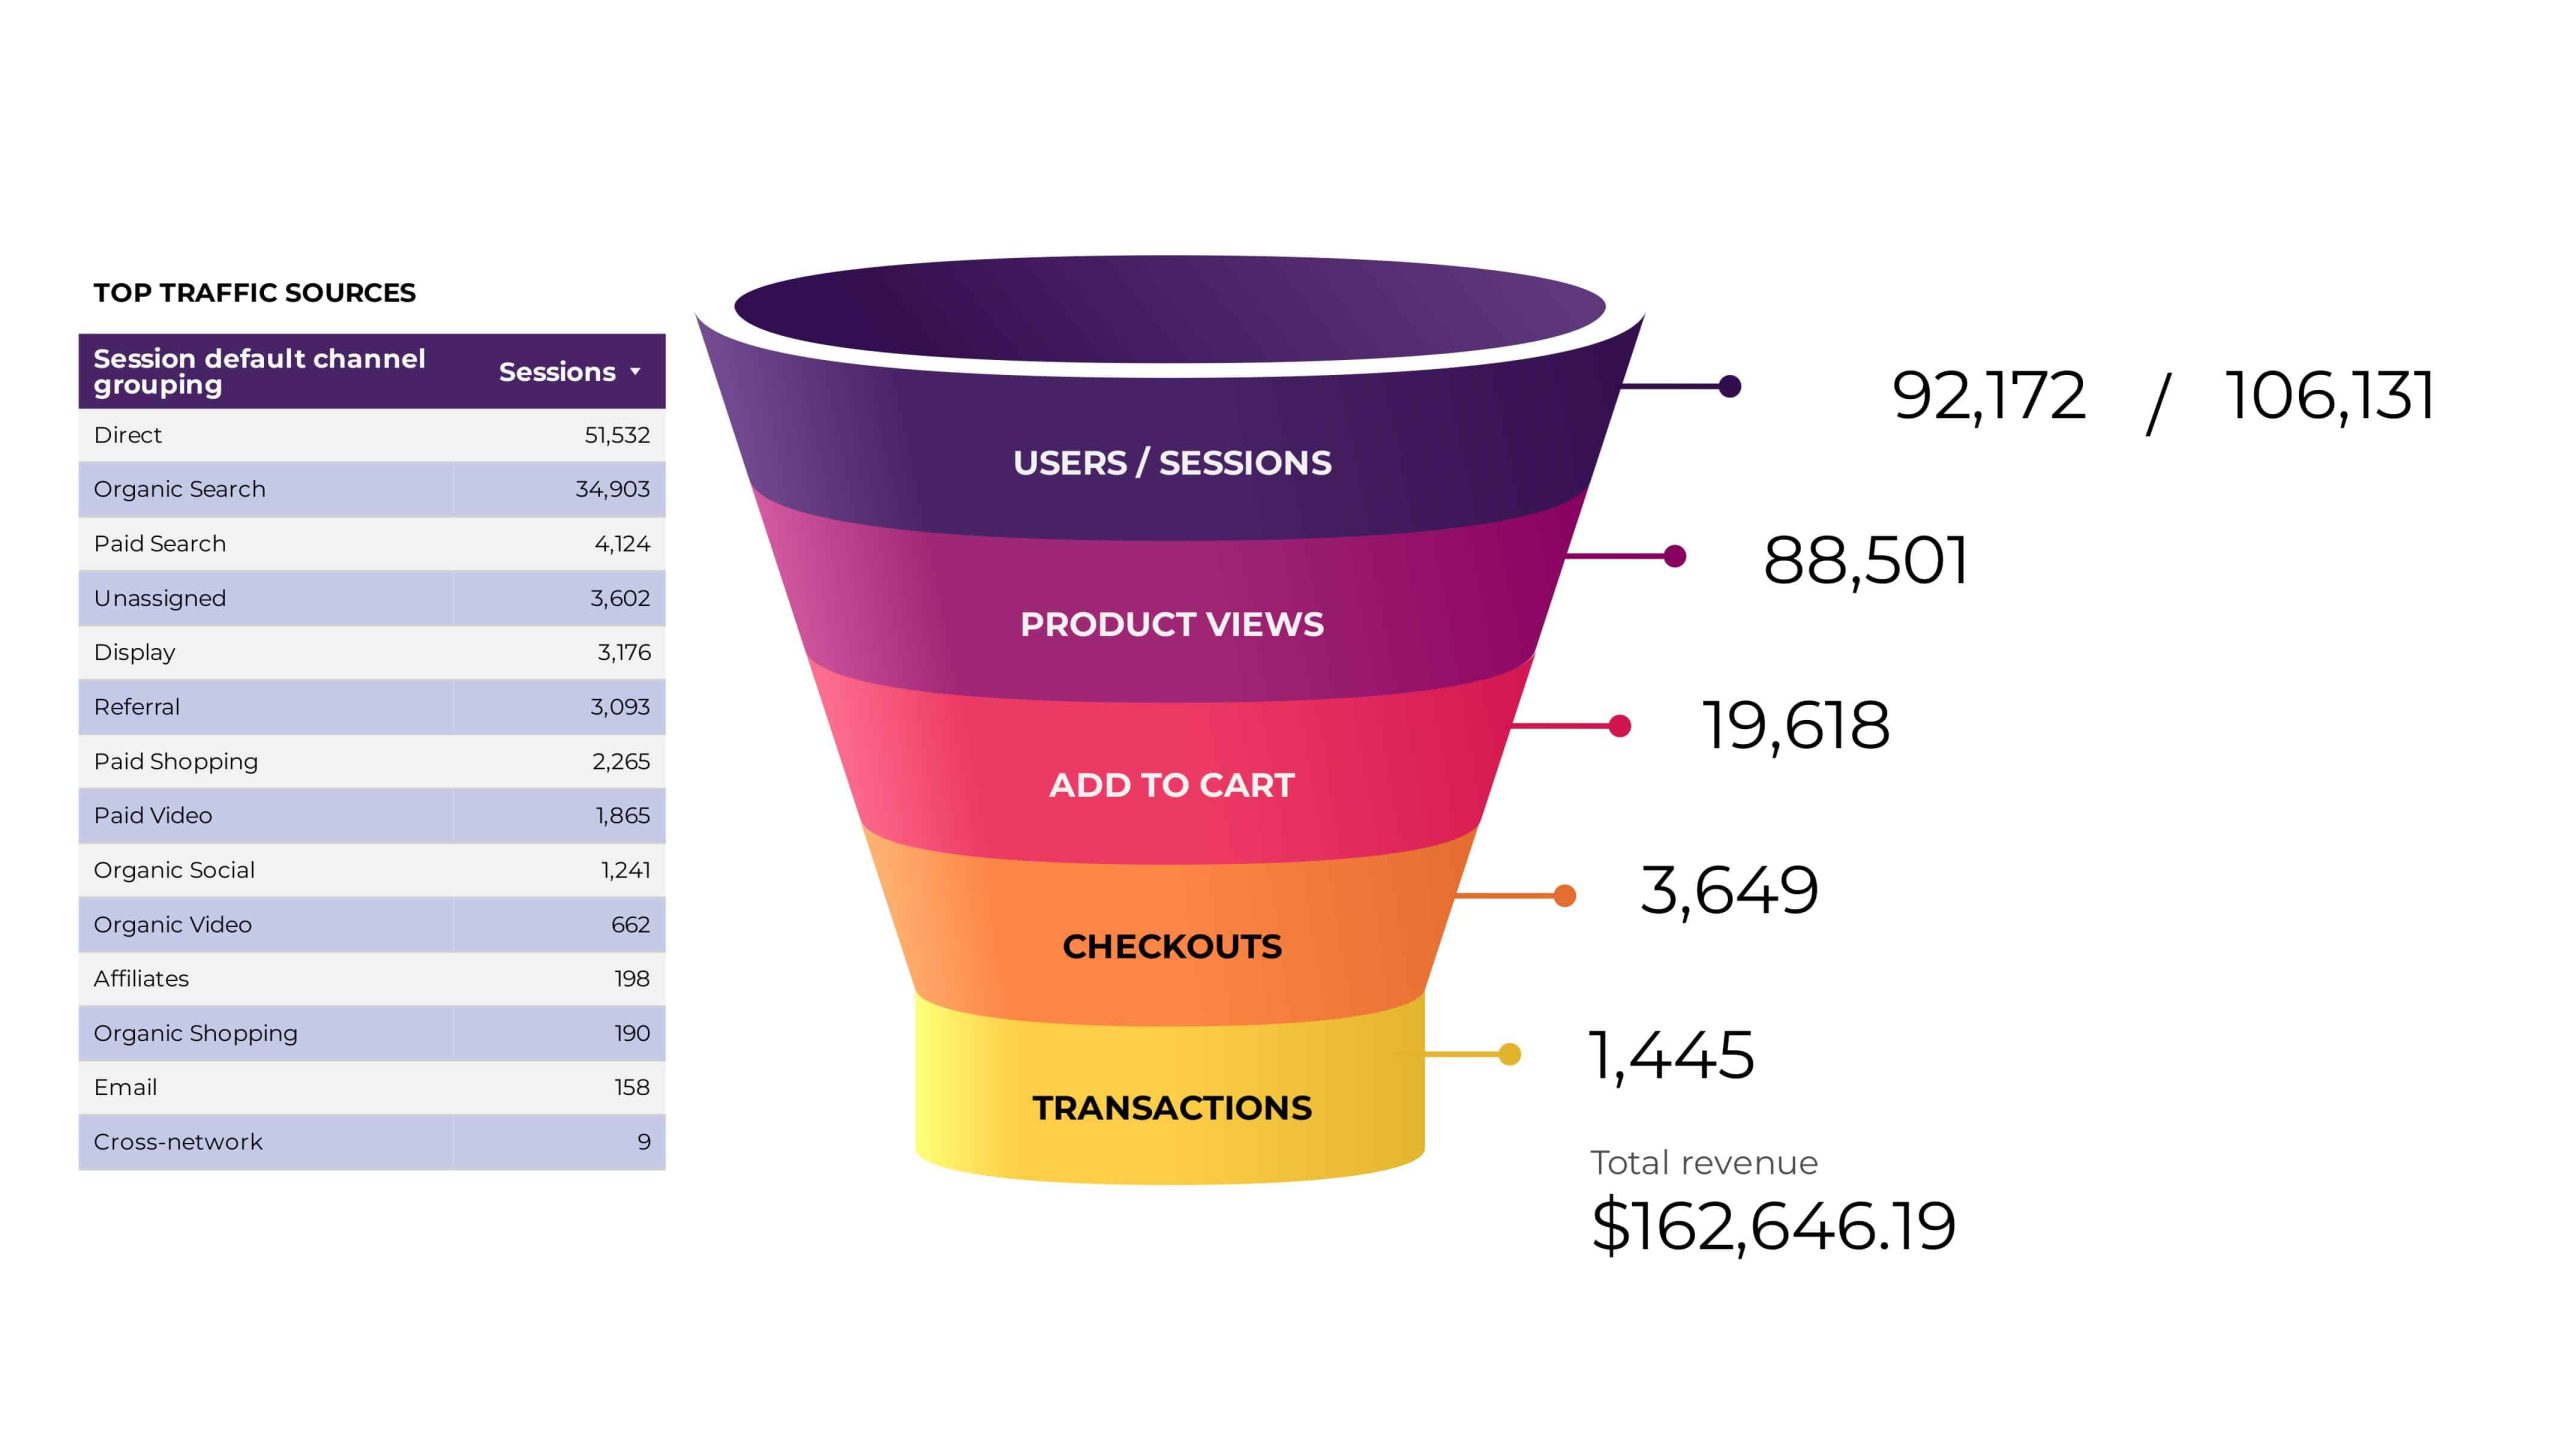
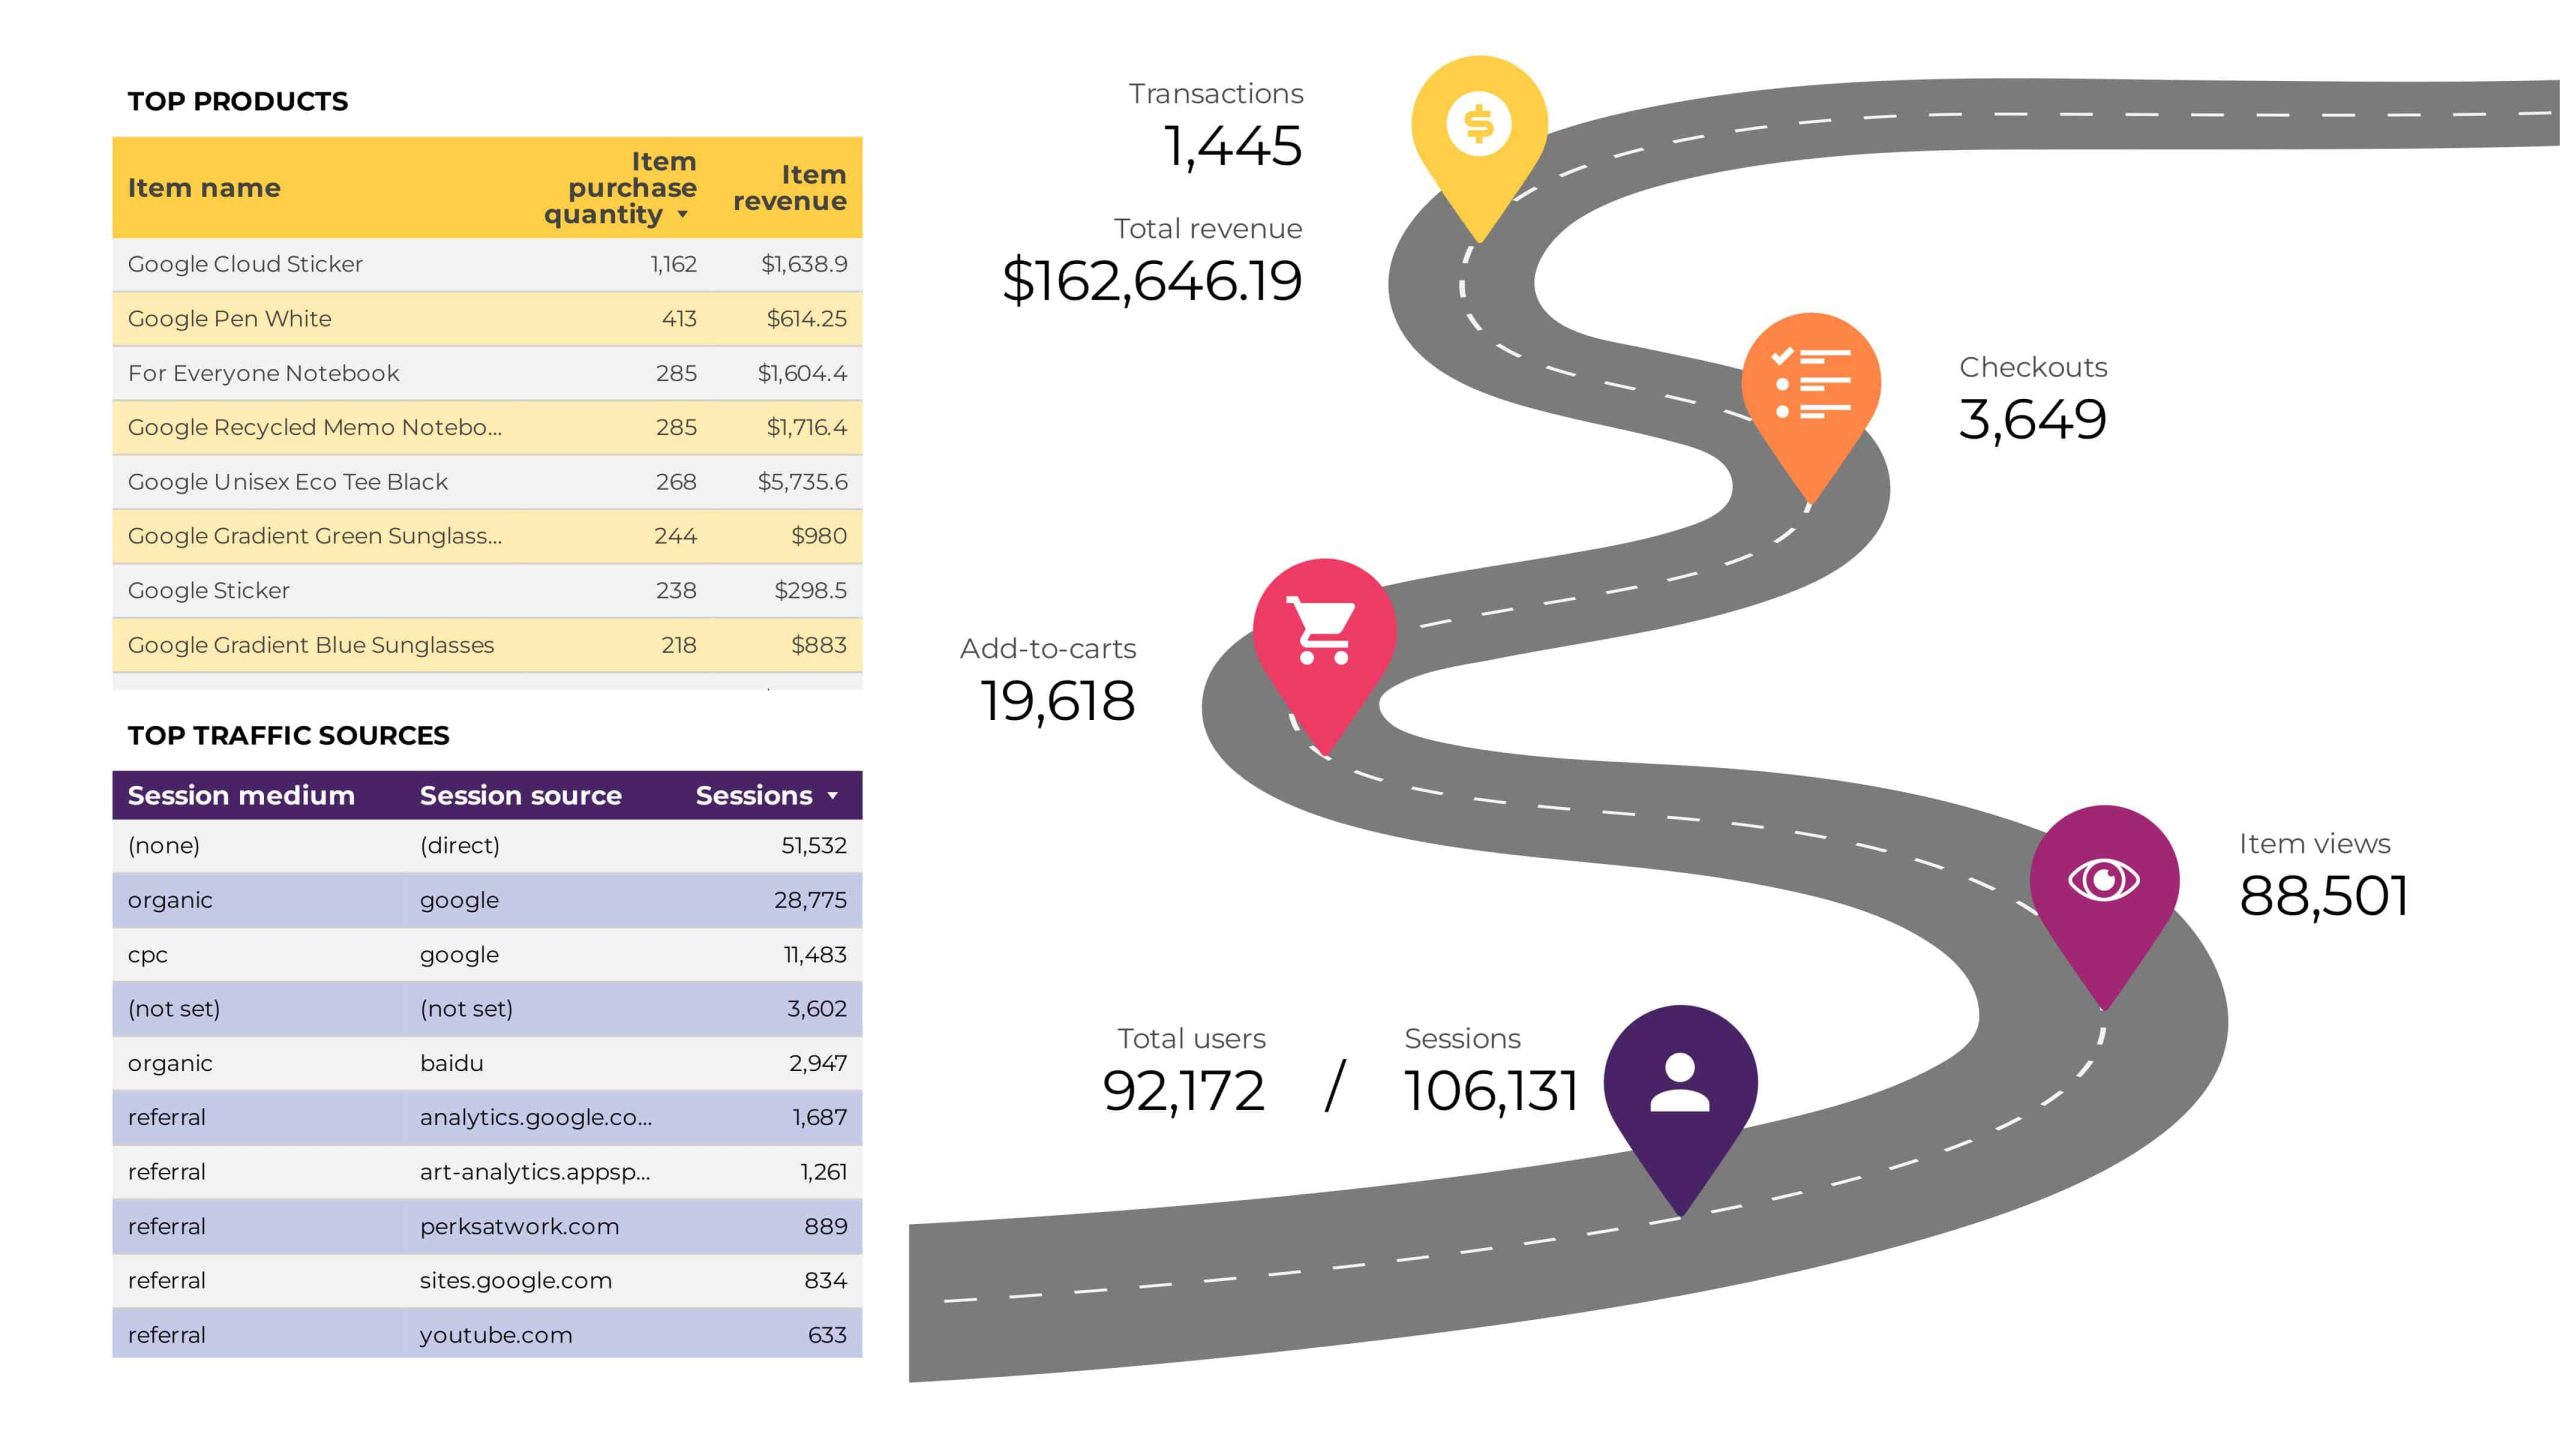
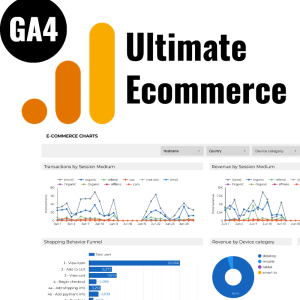
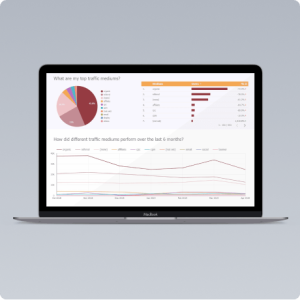
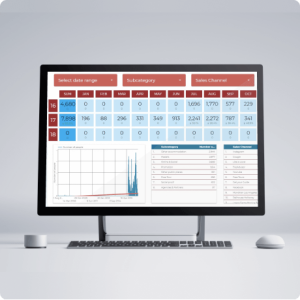
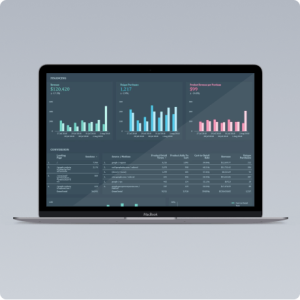
This is a set of nice Google Analytics (GA4) Ecommerce infographics filled with up to date date (ecommerce metrics). Additionally on the setup page, you can set a date range and filters (source, medium, country, device category).

You can get the output as a PDF or copy / paste it to your presentation using a screenshot tool.

All three infographics include these metrics in the ecommerce funnel / user journey:

  1. All users / Sessions
  2. Product views
  3. Adds to cart
  4. Checkouts
  5. Transactions (& Total revenue)


Reviews

1 review for Live Ecommerce Infographics – Google Analytics (GA4)

  1. Jack Kirby

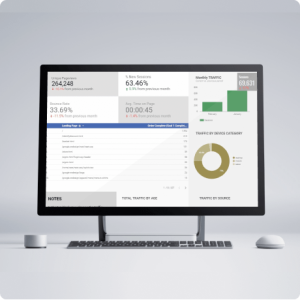
    A beautiful visualization of the ecommerce funnel that my clients have loved.

Add a review

Your email address will not be published. Required fields are marked *

Instant access to your purchase
Built by industry experts — current marketers working in the field.
1000's of resources available today

Sell your templates!

Anyone can become a vendor and there is no sign up cost.  List your templates now and start making extra cash!

Become A Seller Today

Anyone can become a seller and there is no sign up cost.  List your resources today and start making extra cash!