Menu


Google Data Studio is a great data visualization tool. It can be used to visualize data from Google Analytics, YouTube, Search Console, raw data in spreadsheets and much more.
GDS does, however, have limitations. For example, say you wanted to analyze your search keywords separated into long-tail and short-tail keywords. There’s no inbuilt filter to separate by the number of words in a phrase. Using simple regex formulas can overcome many of these limitations and make GDS a far more powerful analysis tool.
In this article, I’m going to show you how to use regex/regular expressions to filter between long-tail and short-tail keywords. This is not an exhaustive tutorial on regex expressions. Rather, I want to provide a concrete example of how using regex can stretch the capabilities of Google Data Studio reporting.
Data Studio offers many more functions other than regex, and you can see them here.
A regular expression, also known as regex or regexp, is a special text string that describes a search pattern. You may have seen and used wildcard characters like “*.txt” to find all files ending in “.txt”.
Think of regular expressions as wildcards on steroids. There are many great tutorials on Regex expressions online.

The focal point of this case study is two questions which address the performance of long-tail and short-tail keywords.. The first question in the dashboard shown above addresses the number of impressions and the cost of long-tail keywords. The second question addresses the impressions and the cost of short-tail keywords.
According to Vertical Response, a short-tail keyword contains one or two words, while a long-tail keyword has three or more words. This is the criteria that we are going to use to define the regex expressions in this article. Also, search keywords may contain numbers, so we will include those as well.
There are many regex testing tools which can help you create and test regex expressions. For this article, we have used: https://regex101.com/.
When using regex101, first, you need to write the regex expression in the field labelled “Regular Expression”. Next, you need to write the content that you want to test in the field labelled “Test String”.

The regex expression: ^([a-zA-Z\d]+\s?\b){1,2}$
Let’s dissect the regex expression above to see how it works:
Let’s test our Regex expression to see if it works.

When you enter a single word, the short-tail keyword regex expression receives a match. This is indicated by the now highlighted test word – “hello,” as well as the text above the “Regular Expression” field that reads “1 match, 10 steps.”

When a second word is added, the regex expression again receives a match. This is because we specified that the pattern should repeat one or two times for the regex expression to pass.

When a third word is entered in the text string, the regex expression returns false and therefore no highlighted words appear. You will also see that the field above “Regular Expression” reads “no match.”
The regex expression: ^([a-zA-Z\d]+\s?\b){3,}$
Again let’s dissect the regex expression above to see how it works:
Let’s test our Regex expression to see if it works.

As you can see, entering 3 words in the test string returns a match. If an indefinite number of words are added, we’ll still get a match. The only condition is that there are three or more words in the sequence.
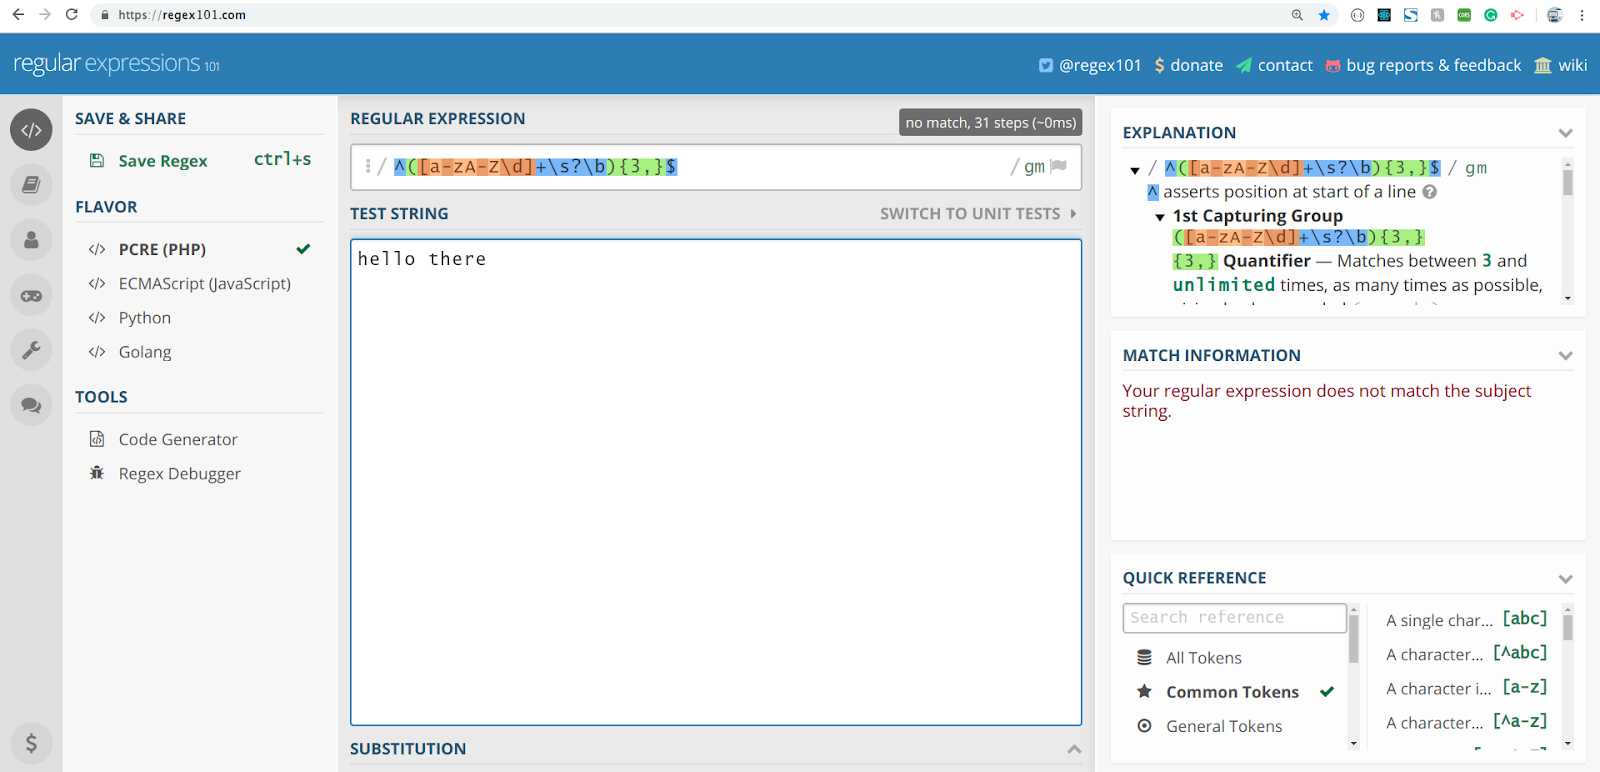
You can see that if the test string is made up of only two words, the regex test fails and no highlighted words appear. You can also see “no match” above the field labelled “Regular Expression.”
Now that we have a working regex expression, we need to use it in the Google Data Studio dashboard. Once you have opened the dashboard, select the preferred chart or table that you want to apply the short-tail keyword length filter to.
Once you have selected the correct chart, scroll down through the panel on the right-hand side of the page until you see the “Add a Filter” button.

Once you have selected “Add a Filter” you will be taken to a list of options to use on your dashboard. If there are existing filters in your dashboard, they will be displayed in the list. In order to create a new filter, which in this example we want to do, you need to select the button at the very bottom of the list – “Create a Filter”.

In order to create the regex expression, you need to use the pull-up dialogue box that appears. You first need to input the name of your regex expression in the “name” value box. It is important to note that the fields need to be set to “Include” and “Search Keyword”.
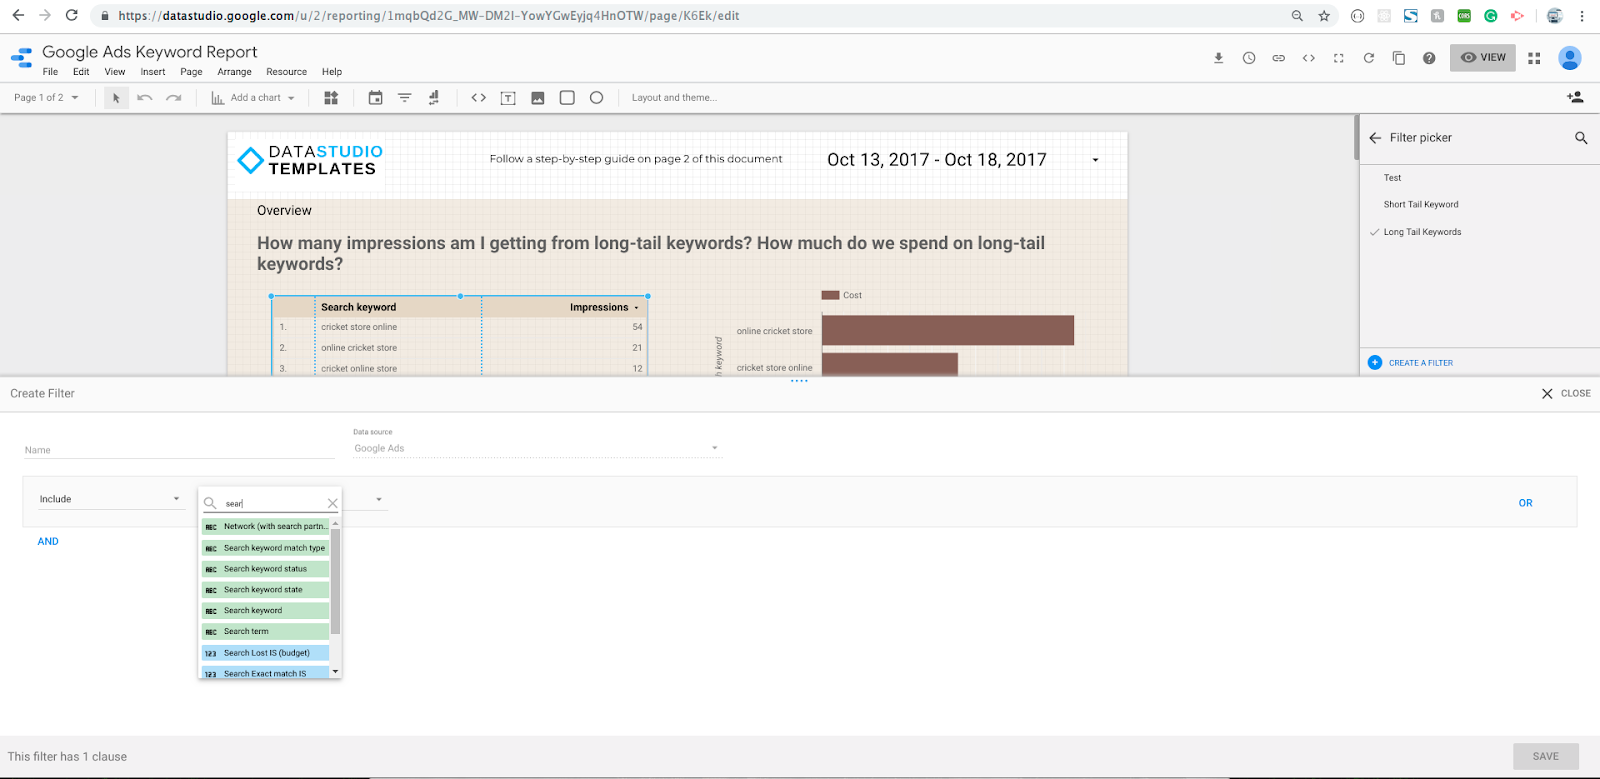
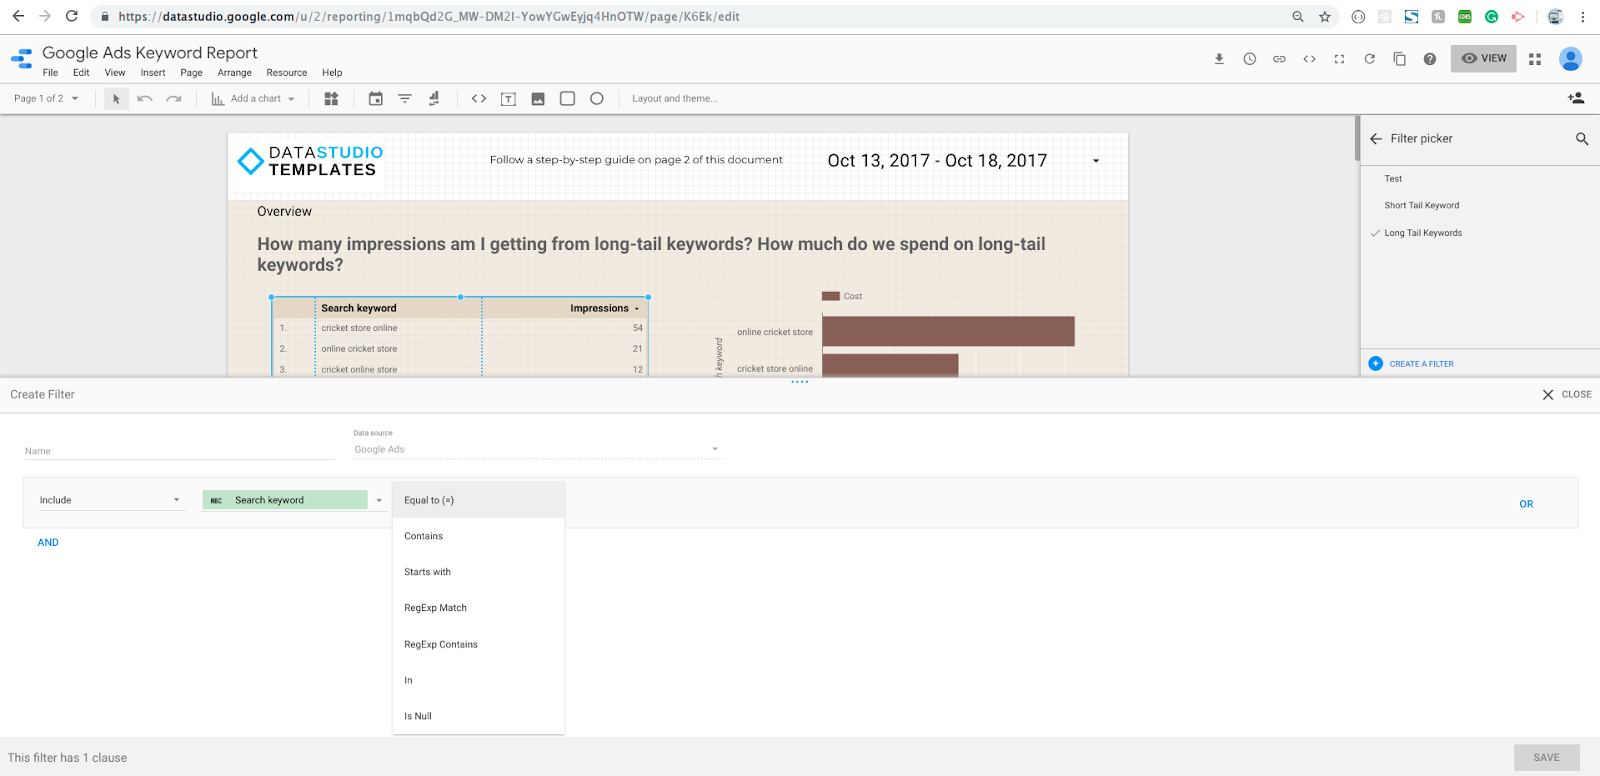
Next, a condition needs to be provided. From the list, select “RegExp Match” as shown below.
Finally, the short-tail regex expression needs to be added, as shown in the image below.

Now that we have a working long-tail keyword regex expression, we need to use it in Google Data Studio dashboard. Once you have opened the dashboard, select the preferred chart/table that you want to apply the keyword length filter to.
Once you have selected the correct chart, scroll down through the panel on the right-hand side of the page until you come across the “Add a Filter” button.
Once you have selected the “Add Filter” button, you will be taken to a list of options to use on your dashboard. If you already have existing filters in your dashboard, they will be displayed on the list. If you want to create a new filter, as we do in this example, you need to select the button at the very bottom of the list – “Create a Filter”.
In order to create the regex expression, you will need to use the pull up dialogue box. First, it is necessary to name your regex. You can enter “Long-Tail Filter” into the “name” value box. It is important to note that the fields need to be set to “include” and “Search Keyword”.
Next, a condition needs to be provided. From the list, select “RegExp Match” as shown below.
Finally, the long-tail regex expression needs to be added, as shown in the image below.
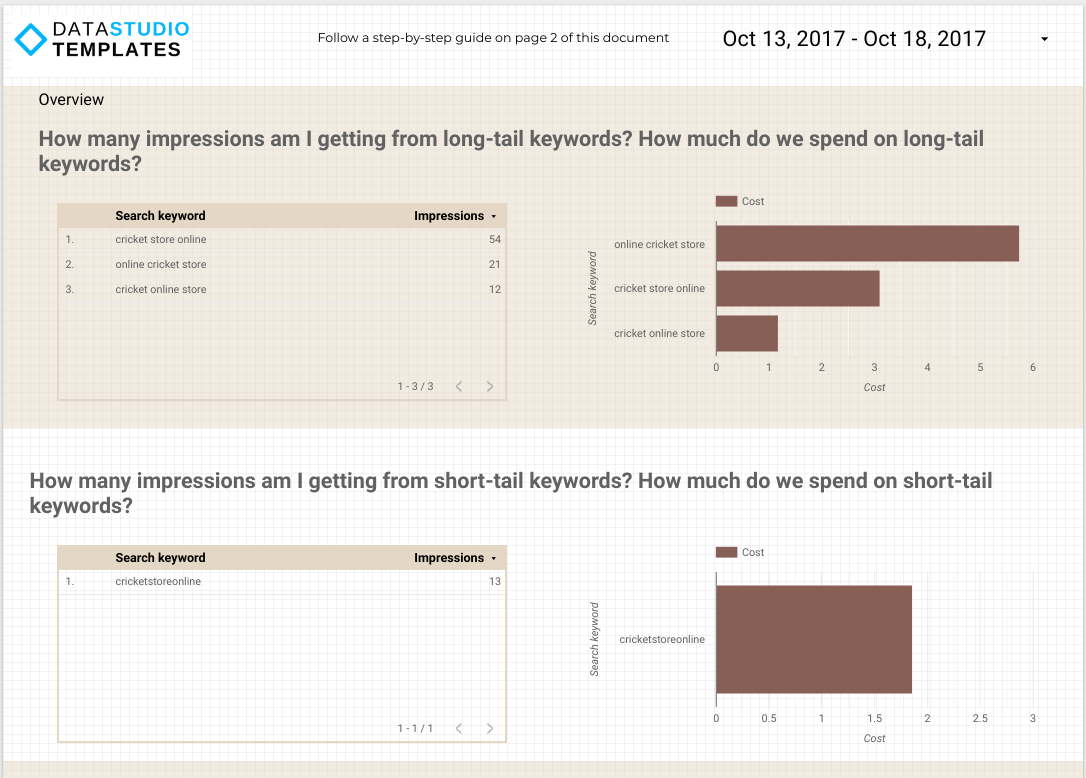
As shown in the above screenshot, with Google Data Studio we can use our regex expressions to correctly filter search keywords. Search keywords with only one or two words have been identified as short-tail keywords, and those with three or more words as long tail keywords.
Although Google Data Studio has limitations, with the correct knowledge and tools it is possible to add versatility to your reporting and use the program to gain a more in-depth insight into your data.
At https://bymarketers.co/, we create custom dashboards designed to visualize all kinds of marketing data. We have everything from YouTube, Google Analytics, Facebook Ads, LinkedIn Ads, Google Ads and a combination of all these and more. Check out our templates here.

