Menu
When Google implemented data transfer limits on Google Analytics, some Looker Studio users had problems. After spending hours and hours creating comprehensive dashboards, they suddenly started getting errors. Their reports needed too many data transfers from GA and they started reaching the limits.
If you’re a power user of Looker Studio who makes comprehensive reports for yourself or your clients, this is a huge problem. Luckily, there’s a work around. You can connect GA4 to Looker Studio via BigQuery to avoid hitting any limits. And you can keep using your dashboards. With Looker Studio’s built-in data source creator wizard, it couldn’t be easier.
This is the second article in a two-part series about connecting GA4 to Looker Studio via BigQuery. Before going any further, make sure you’ve read how to connect GA4 to BigQuery. And then you can learn how to connect BigQuery to Looker Studio.
You should use BigQuery to transfer your data to Looker Studio because Google has started limiting the amount of data you can transfer from Analytics. This has caused tons of problems for big users of Looker Studio as their reports have started hitting those limits. Before Google implemented Analytics Data API quotes it didn’t matter how many data requests your reports made. But since November 2022 reports that make too many requests give errors. So all your hard work building your — or your clients — reports is wasted.
Using BigQuery is a way to bypass these limits. It’s perfect for people who need to transfer a lot of data from Analytics to Looker Studio.
Time needed: 30 minutes
Follow these instructions and you’ll be able to fill your Looker Studio reports with data from BigQuery. These steps follow on from the instructions in part one. If you haven’t already done so, learn how to connect BigQuery and Google Analytics 4.
Before we can start making reports we need to create a data source from our BigQuery data. First, after opening Looker Studio, click ‘Create’ on the left. Then select ‘Data source.’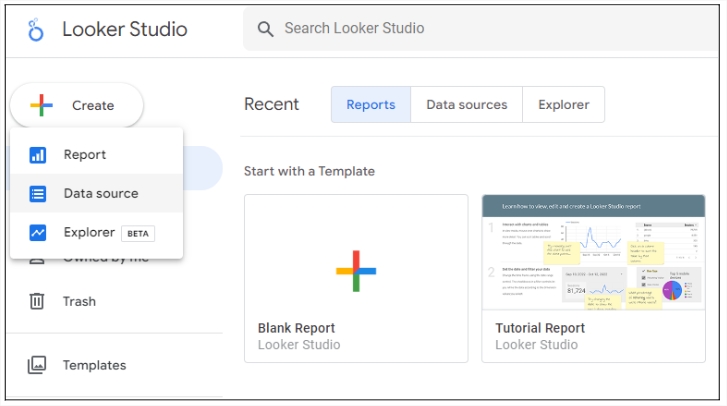
One of the best things about Looker Studio is its built-in connectors. There are 23 in total. These built-in connectors make it a breeze to hook BigQuery up to Looker Studio. For this tutorial, you need to select the ‘BigQuery’ connector.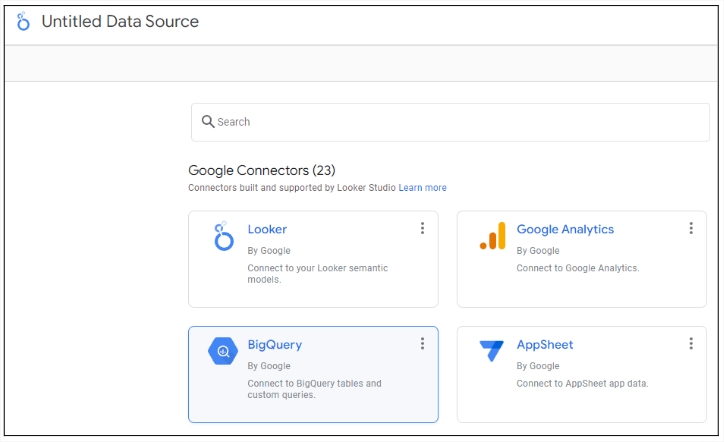
Next, you need to give Looker Studio permission to access your BigQuery data. Click ‘AUTHORIZE’ and we can start bringing your data over.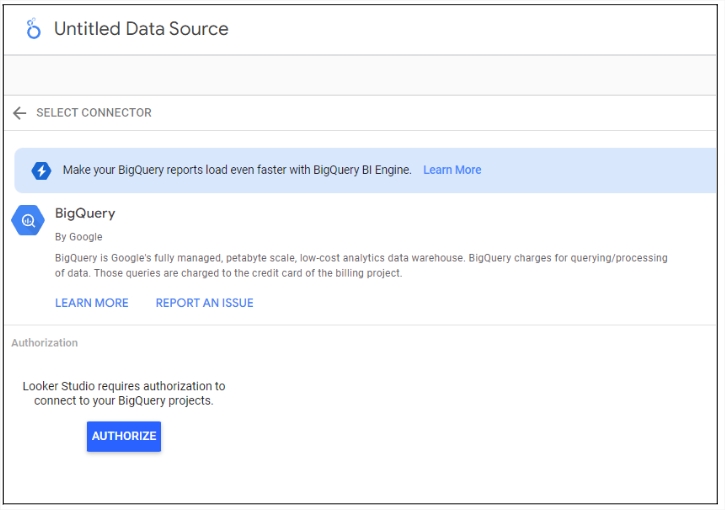
Now you need to use the Google Cloud project you created before linking GA4 to BigQuery. If you haven’t done this yet, follow the instructions for connecting GA4 to BigQuery before going any further with this tutorial. When you’re ready, it’s time to choose your dataset and the project.
For this tutorial we’ll use the public datasets available. But to access your own data, select ‘MY PROJECTS’ and then your Google Cloud project.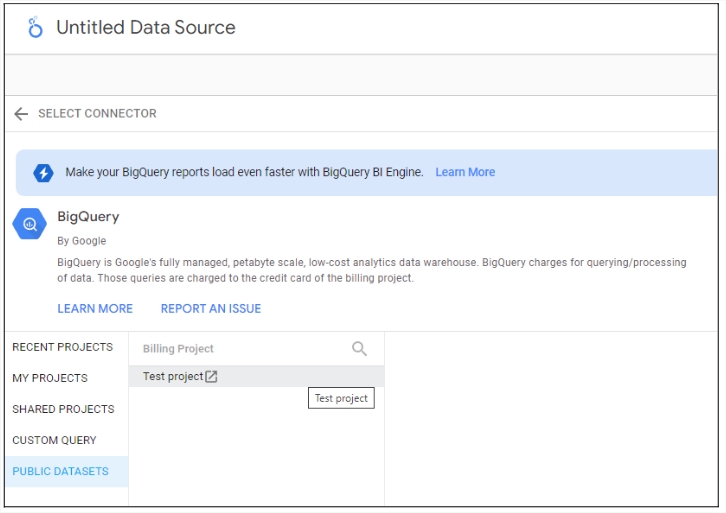
There’s just a couple more steps before you can start visualizing your BigQuery data in Looker Studio. In the ‘Dataset’ column, choose the data you want to transfer. If you’ve only connected GA4 to your Google Cloud project, there’ll only be one option here — your analytics data. Then select the appropriate table, for example, ‘events.’
When that’s done, click connect in the top right corner to finish creating your dataset.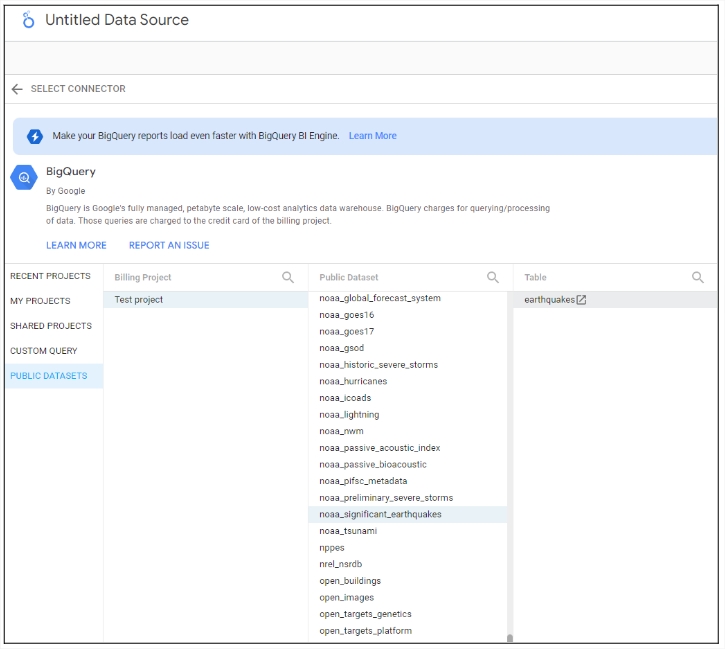
On the next page, you’ll see the fields panel. This is where you can see the dimensions and metrics you’ll use to visualize your data. To fine-tune the data in your report, you can add fields and parameters. You can delete or rename fields. And you can change data types.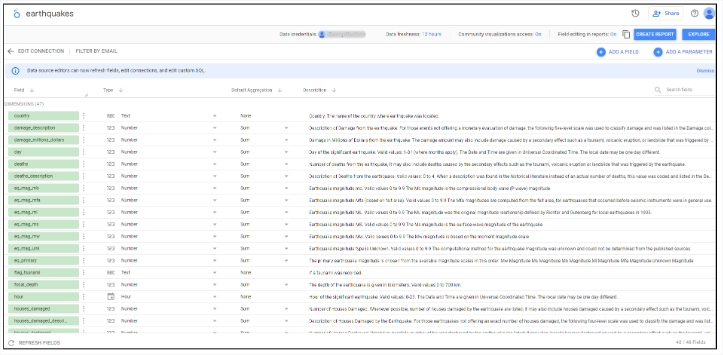
When you’re satisfied with your dimensions and metrics, click ‘CREATE REPORT.’ This makes your report in Looker Studio — you’re now ready to start visualizing your data.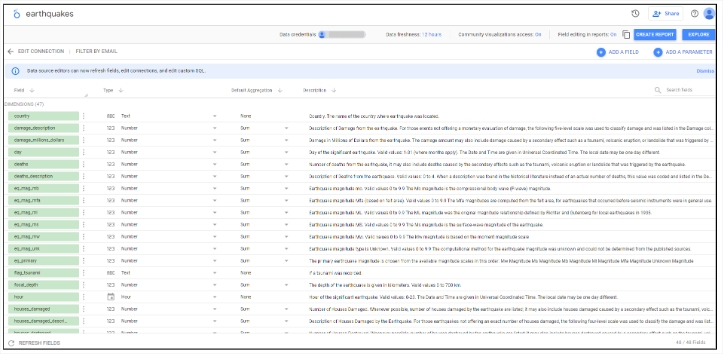
On the right you can see two columns — ‘Data’ and an empty column. By dragging and dropping fields from the ‘Data’ column to the report, you can add charts. And when you click on the chart, editing options appear in the other column. For more
on how to use Looker Studio to visualize your data, check out our ultimate guide to charts and graphs and some advanced data visualization tips.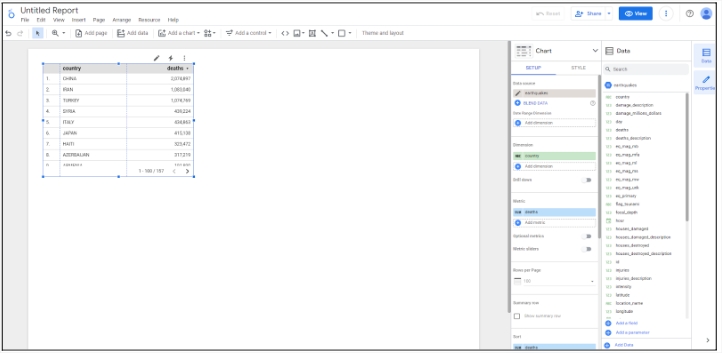
When you’re ready to get started analyzing your BigQuery GA4 data in Looker Studio, take a look at some of our Looker Studio templates. By using our ready-made resources, you can get up and running in no time. For example, you can use this dashboard to visualize your users’ journey or use this template to get an overview of your key paid marketing channel performance.
Google Looker Studio is a powerful, and free, data visualization tool. With its built-in GA connector, you can get set up in minutes. It allows you to create a range of different charts to visualize your data. And you can collaborate with team members and share with clients in just a few clicks.
Yes. There is a native connector to Google Analytics 4. And for Looker Studio users who don’t make huge reports, this is the best way. But if you’re a power user, with big reports that make a lot of transfer requests, BigQuery might be better. That’s because you can get around Google Analytics data transfer limits. The only downside is that BigQuery isn’t free.
Tons of ways — Looker Studio is one of the most versatile tools out there. Check out the best Looker Studio templates that you can get in 2023 for inspiration.
Yes! Here are some of the most useful templates available on byMarketers. There’s an all-in-one GA4 analytics dashboard. And a GA4 audience experience dashboard. There are so many more — check out our full range of Looker Studio resources.
Get a Premium GA4 Template for FREE
A marketplace to buy and sell 100’s of high quality templates, dashboards and reports from Looker Studio templates to Contracts and SOWs. Instant download and product support is what sets us apart.