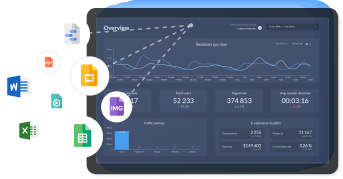
Template to analyze everything that happens in your online store with data from Google Analytics 4. Save time and avoid headaches with GA4. With this report you can also see the conversion funnel of your ecommerce. Report of 10 pages, with menu to navigate between pages and switch from MoM to YoY.
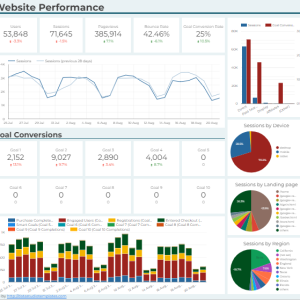
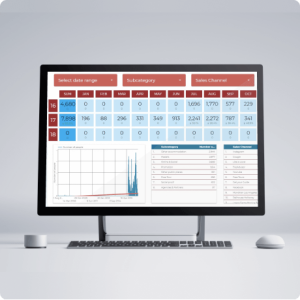
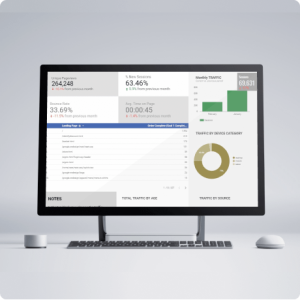
Page 1: General data (MoM)
- Key metrics with comparisons in percentage and absolute terms
- Previous month’s time chart of revenues and transactions
- Revenues and transactions by country
- Revenues and transactions by channel
- Revenue by device category
- Most purchased items in the store
Everything can be filtered by Channel, Country and Device through the header controls.
Page 2: General data (YoY)
- Same as the previous page but all compared to the previous year’s period.
Page 3: Products (MoM)
- Viewed items, purchased items and store revenue, with filter to choose the Product, Product Category or Brand (if any).
- Revenue and items sold by product category (bar chart and table)
- Revenues and items sold by product brand (bar chart and table)
- Yield per item
Everything can be filtered by Channel, Country and Device through the header controls.
Page 4: Products (YoY)
- Same as the previous page but all compared to the previous year’s period.
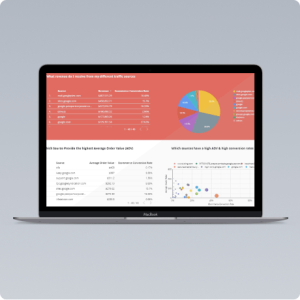
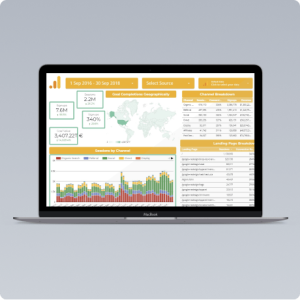
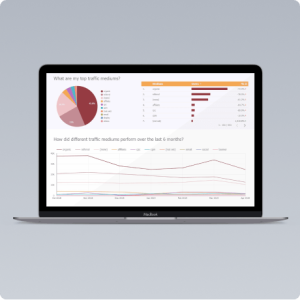
Page 5: Channels (MoM)
- Revenues and transactions by channel (bar chart)
- Revenues and transactions by cove (pie chart)
- Transactions by channels and months (current year)
- Performance by channel with relevant ecommerce metrics
- Performance per item with relevant ecommerce metrics (table connected to the previous one in order to analyze which products are sold more by each channel)
Everything can be filtered by Channel, Country and Device through the header controls.
Page 6: Channels (YoY)
- Same as the previous page but all compared to the previous year’s period.
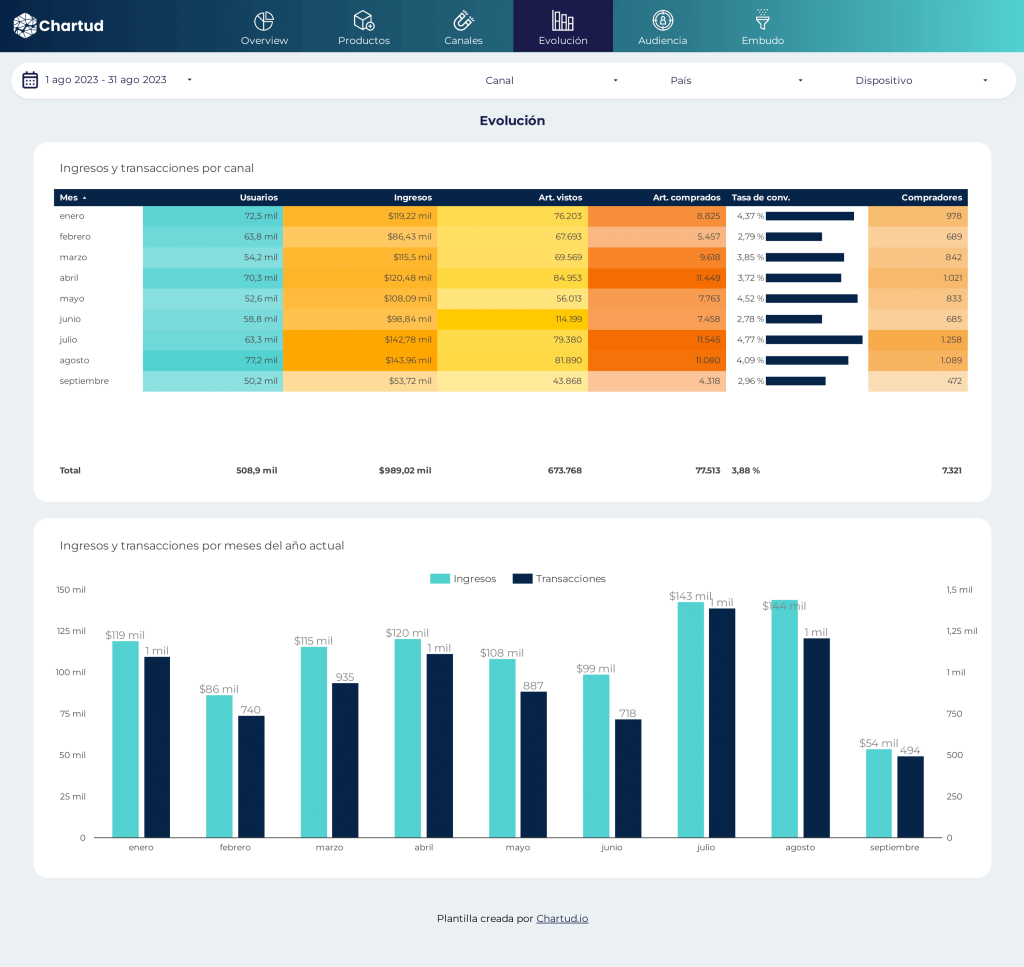
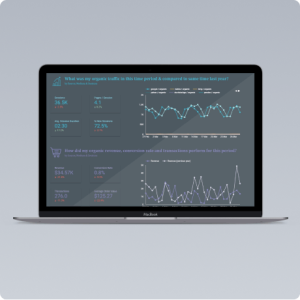
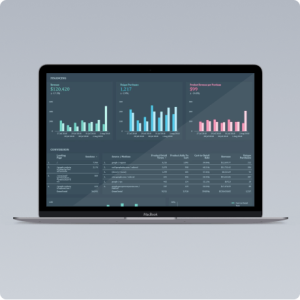
Page 7: Evolution
- Table with Users, Revenues, Items viewed, Purchased, Conversion rate and Buyers by month of current year
- Bar chart with revenues and transactions by months of the current year
Everything can be filtered by Channel, Country and Device through the header controls.
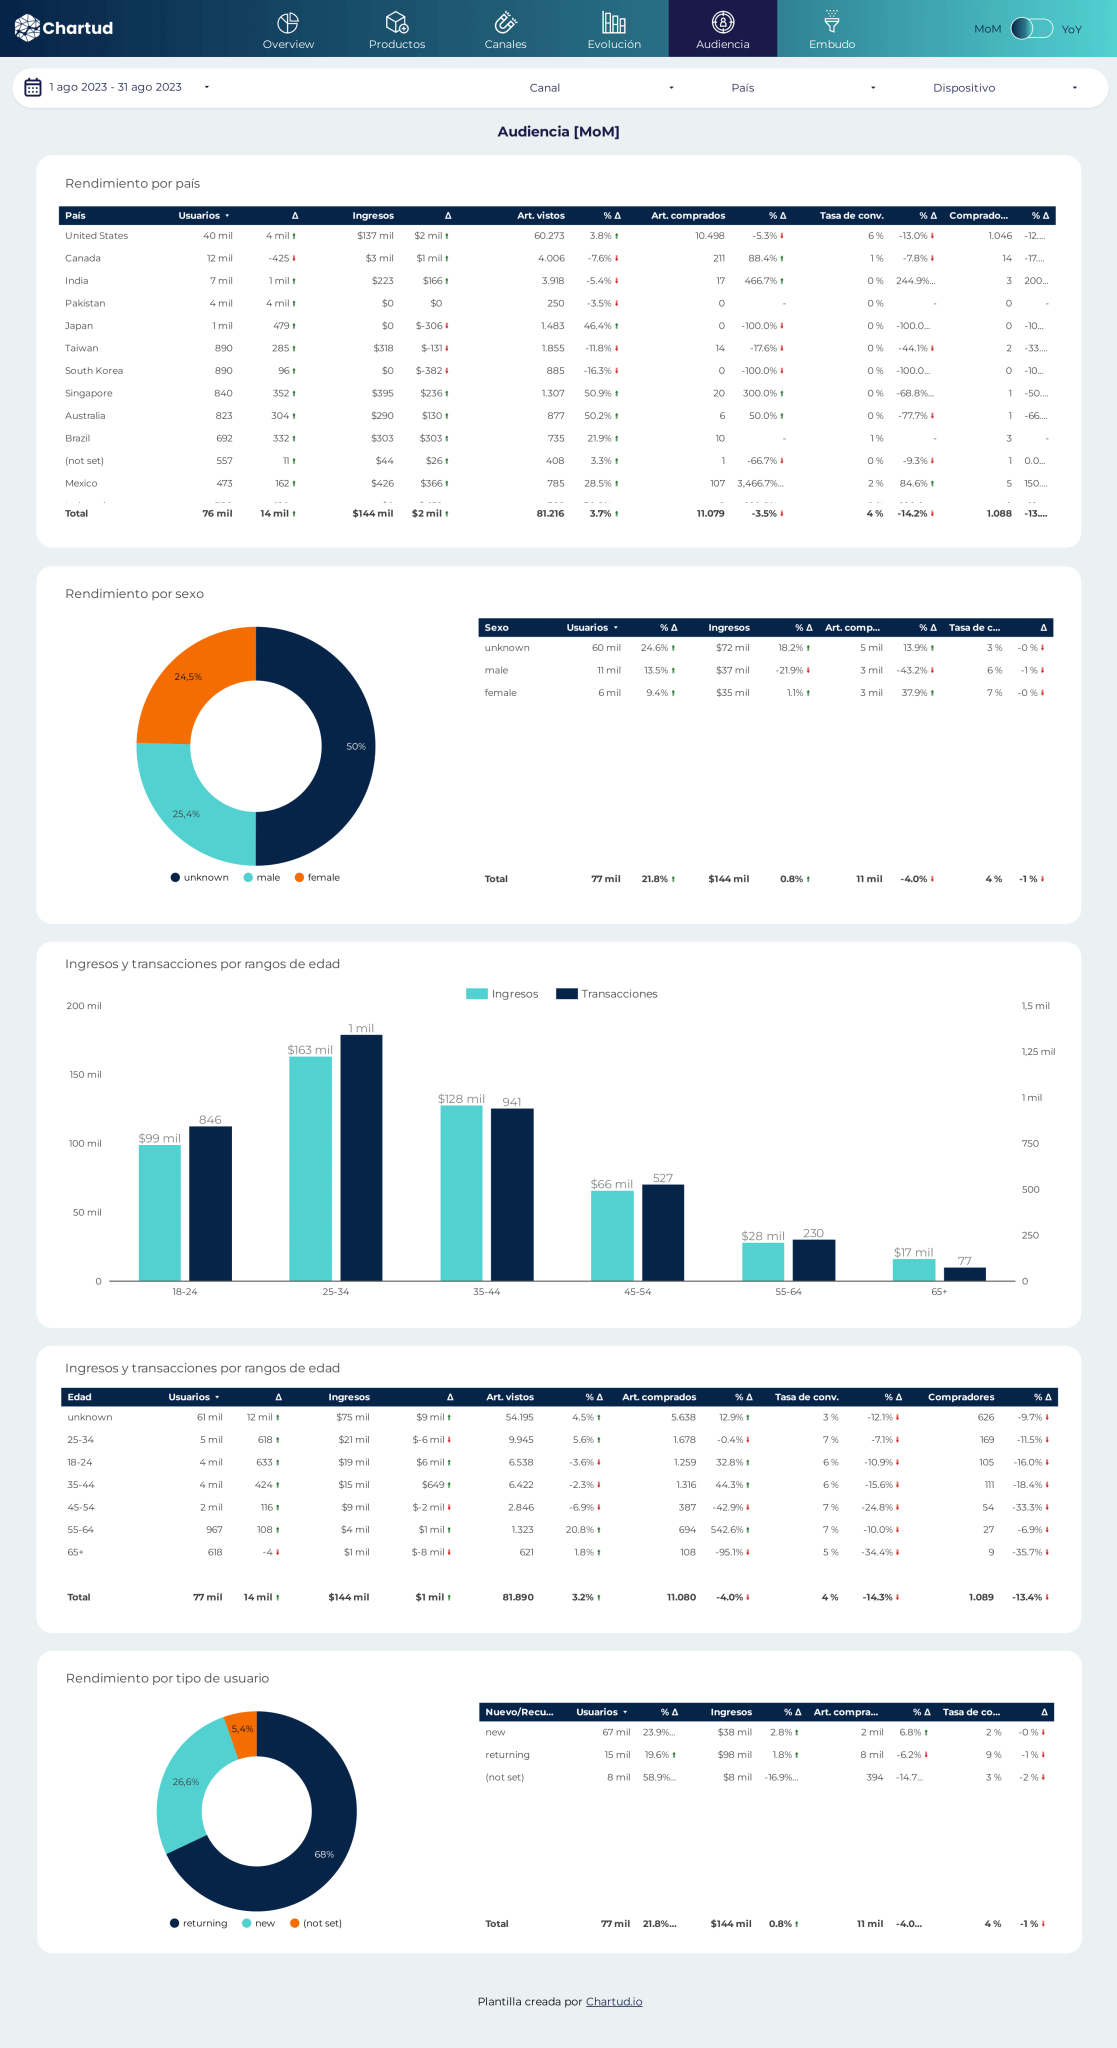
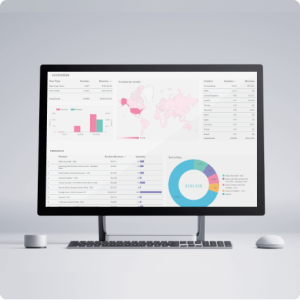
Page 8: Audience (MoM)
- Ecommerce performance by country
- Performance by gender
- Revenues and transactions by age range
- Performance by user type
Everything can be filtered by Channel, Country and Device through the header controls.
Page 9: Audience (YoY)
- Same as the previous page but all compared to the previous year’s period.
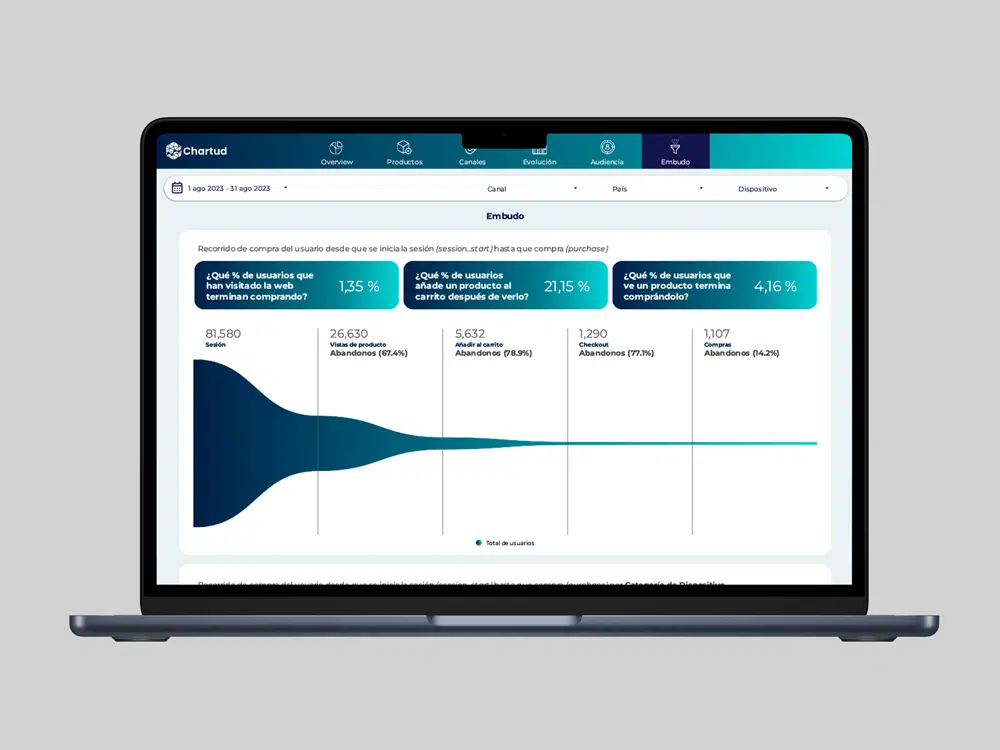
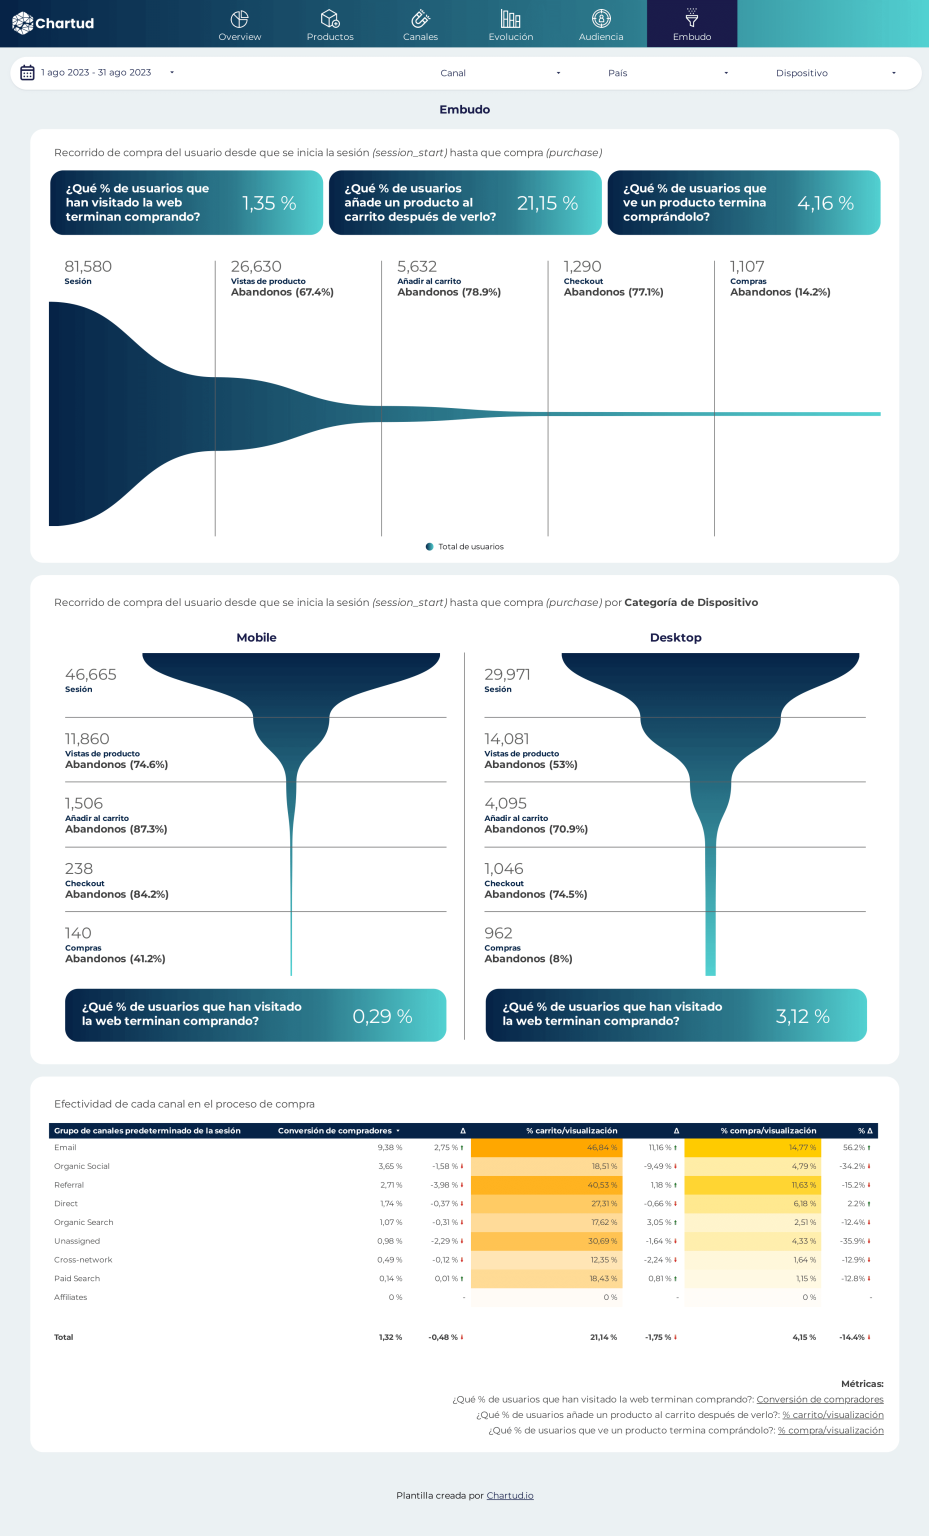
Page 10: Ecommerce funnel
- General horizontal funnel of the website with relevant metrics
- Mobile vertical funnel with conversion metrics
- Desktop vertical funnel with conversion metrics
Everything can be filtered by Channel, Country and Device through the header controls.
Difficulty in adapting the template
Simple, in 1 minute. You will only have to connect your Google Analytics 4 data.
It is necessary to have the ecommerce events configured.
Colors and logo can be easily customized.