Menu
Units Sold: 1
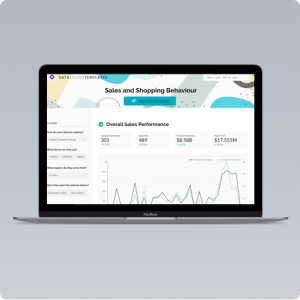
This is a one page clean report designed to give you a quick and effective overview of how your business is performing, displaying as example a Store business model. The top section provides a summary of sample key metrics, as Profit, Sales, Orders, with the possibility to filter by Region and Time Period, so that in one quick look you get to know your data.
As you scroll down, you’ll get the possibility to explore in more detail each of the key metrics, as they are presented plotted over time and in relation to different dimensions, Region, Categories and Products. These visualizations give you the possibility to quickly realize which are the top performers that influence the most your KPIs and showcase examples of how to effectively create and present several types of visualizations.
This template connects to a Google Sheet as the only data source, containing the Superstore dataset, a customer centric data set, containing the data on all orders placed through different vendors and markets, from 2014 to 2017.
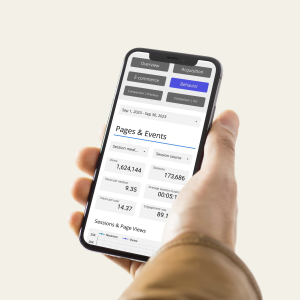
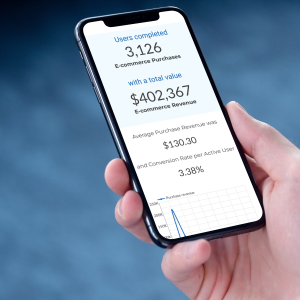
It adapts to any screen size, including mobile.
Anyone can become a vendor and there is no sign up cost. List your templates now and start making extra cash!
Anyone can become a seller and there is no sign up cost. List your resources today and start making extra cash!
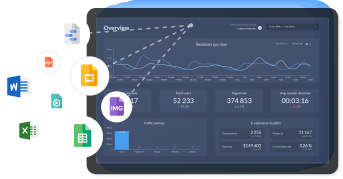
A marketplace to buy and sell 100’s of high quality templates, dashboards and reports from Looker Studio templates to Contracts and SOWs. Instant download and product support is what sets us apart.
Darnell Jensen –
This is a nice and clean design which lets me see most things easily. It doesn’t do everything but for the money I am happy. Also works well on mobile.