Menu


As an eCommerce business you are likely to come up against a mountain of data on a regular basis. This, of course, can make for a challenge when it comes to distilling signals from noise. But it’s crucial for you to be able to easily access, centralise and analyse your data whether inventory, sales, marketing or financial information.
The right tool set will not only help you in collect the data but also present, visualise and then share the information and key takeaways. Ultimately, with the right data sets and the right tools to interpret them, you can make better decisions.
Google Looker Studio provides an elegant solution for eCommerce businesses that need to handle vast amounts of data. This tool has a number of benefits which make it an excellent utility for eCommerce businesses. These advantages include features allowing:
Templates are a key feature separating Looker Studio from other visualization tools. Looker Studio is backed by a strong community of experienced marketers and eCommerce businesses that make their pre built templates available. When it comes to eCommerce this library of useful templates is very useful as it aggregates the experience and lessons learnt by other businesses dealing with similar challenges.
In this post, we will take a look at the best Looker Studio Templates for eCommerce business.
Limited detail
Easy
An overview of eCommerce performance and internal reporting
Google Analytics 4
byMarketers
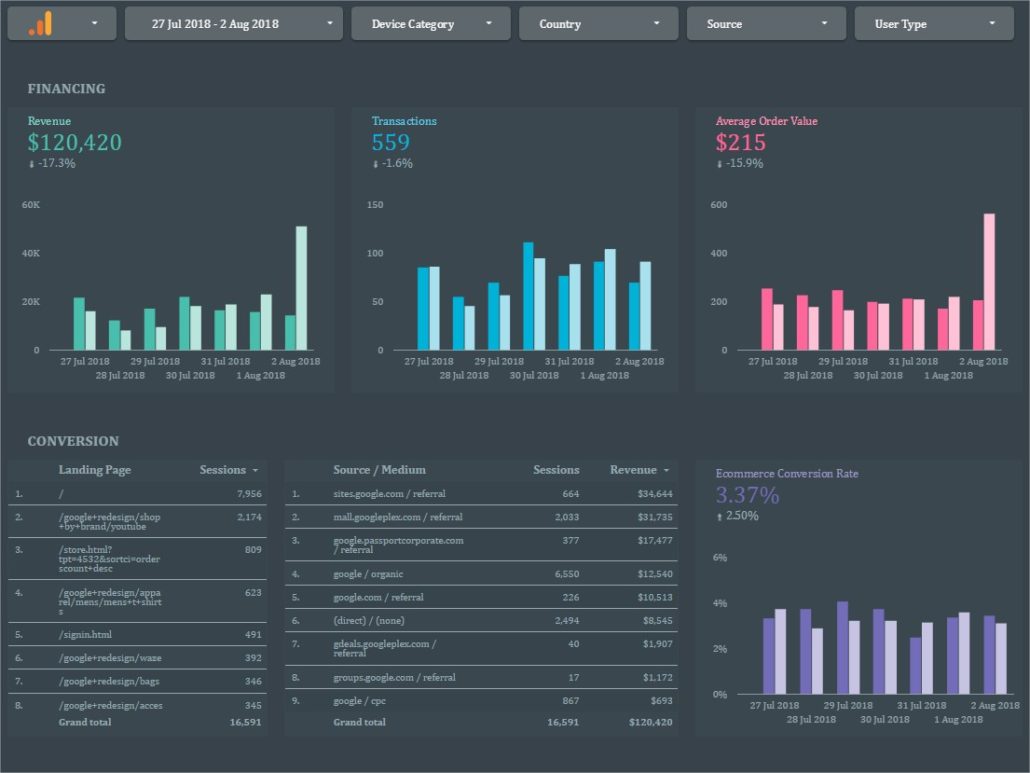
This template is perfect for eCommerce sites looking for an elegant dashboard that is highly presentable and won’t hurt the back pocket
You can share the dashboard with other people in your company and stimulate informed discussions around sales and revenue. The template shows year-on-year revenue, purchases, and even revenue per purchase.
This template also shows data on product views and add-to-carts. With custom filters provided out of the box, you are empowered to filter data based on date, Analytics profile, source, country, and user type.
Additionally, this particular template breaks down eCommerce data into several logical sections all clearly labelled as Financing, Conversion, Customers, and Product. You can view the current data, compare it to the previous period, and analyse the trend.
The dashboard aims to answer key questions in a clear way: How much revenue are we getting? How many people are converting, and how does their conversion vary by landing page and source/medium? What are the demographics of our customers? Which products do customers buy the most?
Plus, it is developed by us so we can vouch for its quality! 😉
Very basic as it lacks details and design
Easy
Someone looking to build off a very basic platform
Google Analytics 4
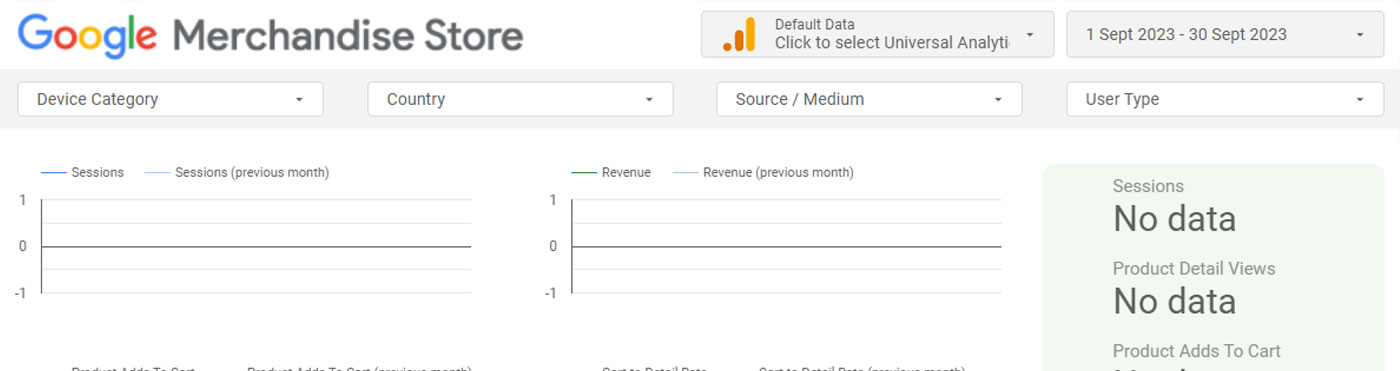
The Google Merchandise Store Report is developed and made available by Google.
This dashboard includes all the important dimensions and metrics you will likely need, including sessions, product add-to-carts, revenue and cart-to-detail rate as both an aggregate and per product or medium basis. You can filter the data by device category, country, user type, and source/medium to help drill down on your analysis.
We like the dashboard for a few reasons, not least of which is that it allows you to view overall trends and also highlight product-specific information. All in all, Google has done a good job giving you the option to home in on focused data whilst still including top-level information all on the same view.
The template is quite simplistic though, so while it’s a nice and concise report it does lack for detail.
Not as comprehensive as some other reports
Easy
eCommerce website managers looking for insight into sales and shopping performance with an easy to use, nicely designed report
Google Analytics 4
byMarketers
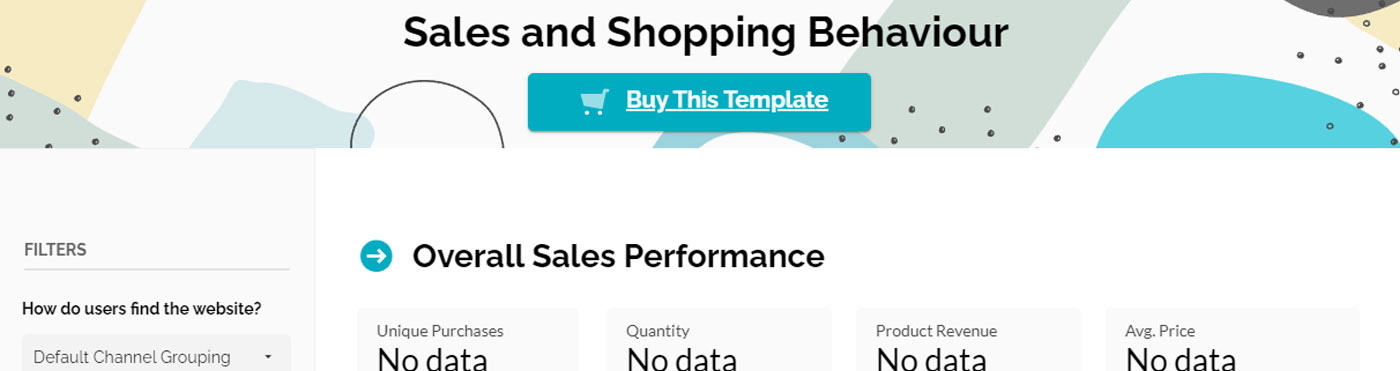
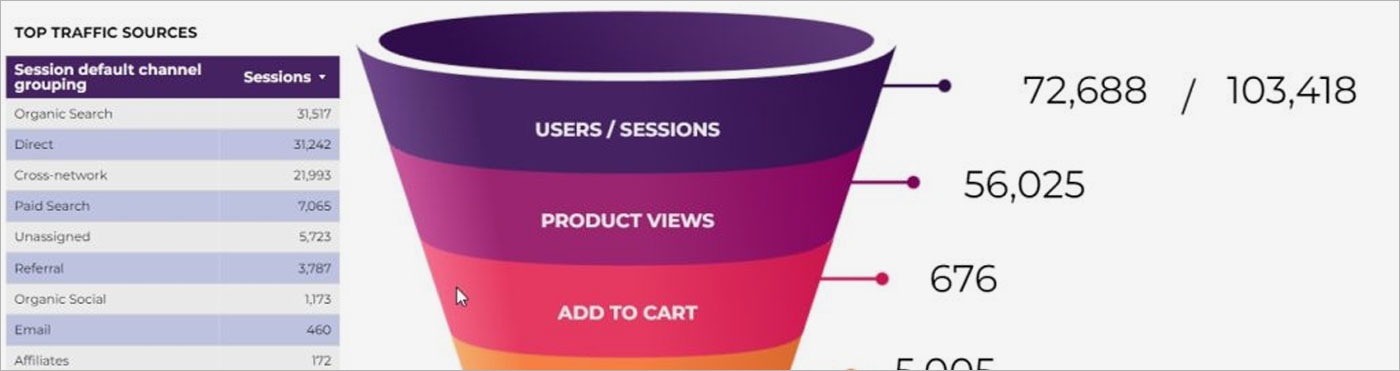
This template does just what it both claims and needs to do: It provides insight into shopping and sales performance for eCommerce websites. But that’s not all it does; it also gives insights into channels and devices as a bonus feature.
What is striking about this template is the design it provides. The top part of the template provides a number of intuitive filters that are great and easy to use in isolation or combined. The use of large icons and graphs to shout out sections and highlight information has also been well done. The attention to detail on this dashboard is high and it’s the key reason we have included it in this review.
The design allows the dashboard to stand out and provide strong insights to the user. If you are interested in sales and shopping behaviour, you have most of the information you need right here and a funnel through which to use it. It shows unique purchases, quantity purchased, revenue, and average price. Plus, it displays the basket-to-detail rate, buy-to-detail rate, brand performance, product performance, channel performance, and device performance as well.
This dashboard is good for eCommerce businesses doing a monthly or quarterly introspective of their business. During your analysis, you can dissect your eCommerce data through a plethora of filters and date ranges. With this template, your long sales meetings can finally be productive!
It might be overwhelming for those looking for a simple report
Easy
eCommerce website managers looking for insight into sales and shopping performance with an easy to use and nicely designed report
Google Analytics 4
Chartud
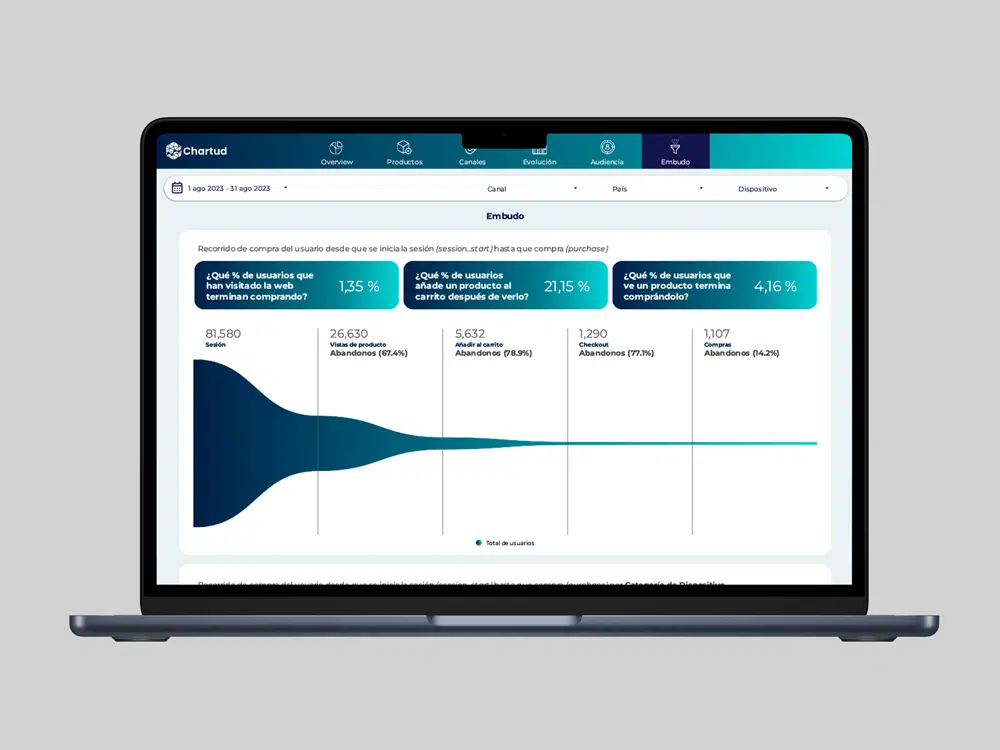
This template offers a comprehensive report for any eCommerce business to use and glean useful analysis from. It provides a deep level of insight into eCommerce platform performance by connecting to your GA4.
But it can actually be considered more than just a template. It is really a tool capable of visualising and deeply understanding your store’s traffic and performance in a more robust and informative way.
Despite the comprehensive nature of the template, it offers a user-friendly solution with clear overviews of everything from month-over-month (MoM) to year-over-year (YoY) data, including demographic segmentations. The filters allow you analyse viewed and purchased items, yield per item, and even revenue breakdowns by product category and brand.
With its easy connectivity to Google Analytics 4 data, it’s a strong choice of template for eCommerce businesses needing to enhance their analytics capabilities.
Does not have a wide coverage of website metrics
Easy
Anyone that wants to visualize their websites traffic flow
Google Analytics 4
Web Analytics Setup
This template is purpose-built for eCommerce businesses needing to visualise their end-to-end sales funnel. It offers two separate funnel visualisations as well as a journey page for just that purpose.
We recommend viewing the demo before buying as it is difficult to describe just how useful these visualisations are: It’s much better to see it for yourself!
As far as usefulness goes, the template streamlines the process of presenting important eCommerce metrics, eliminates the need for manual data entry and offers easy customisation to help you make more informed decisions based on real-time analytics.
Easy
Shopify websites that want their data customizable in Google Sheets
Shopify
Coefficient
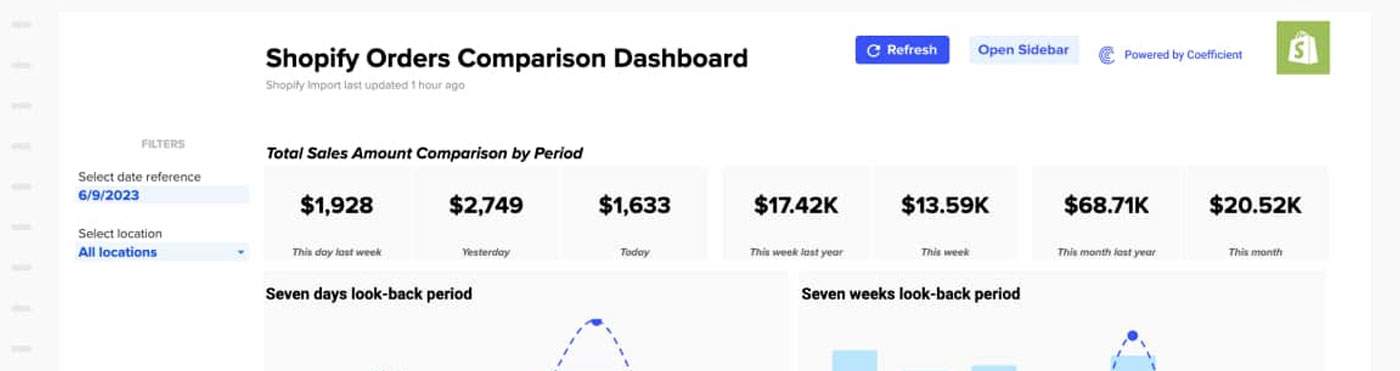
This template is designed specifically for Shopify businesses wanting their order data in Google Sheets. It helpfully allows you to customise the way you use your data as well as share it with team members and stakeholders.
The template provides pre-built visualisations and tables so you can immediately start gaining value from the design and the build.
Overall, the report provides an efficient way to keep track of store performance over time and produce performance assessments. The dashboard enables an easy view of key metrics, enhancing your understanding of order performance and overall ecommerce effectiveness.
As noted above, while the product itself is free to use, connecting it with GA4 may require a paid data connection.
eCommerce businesses can significantly enhance their decision-making capabilities and performance insights with the right Google Looker Studio.
With a range of templates out there suitable for a range of preferences and businesses, it is easier and more affordable to take a deep dive into your eCommerce store’s data than ever before.

