🤔 What is it?

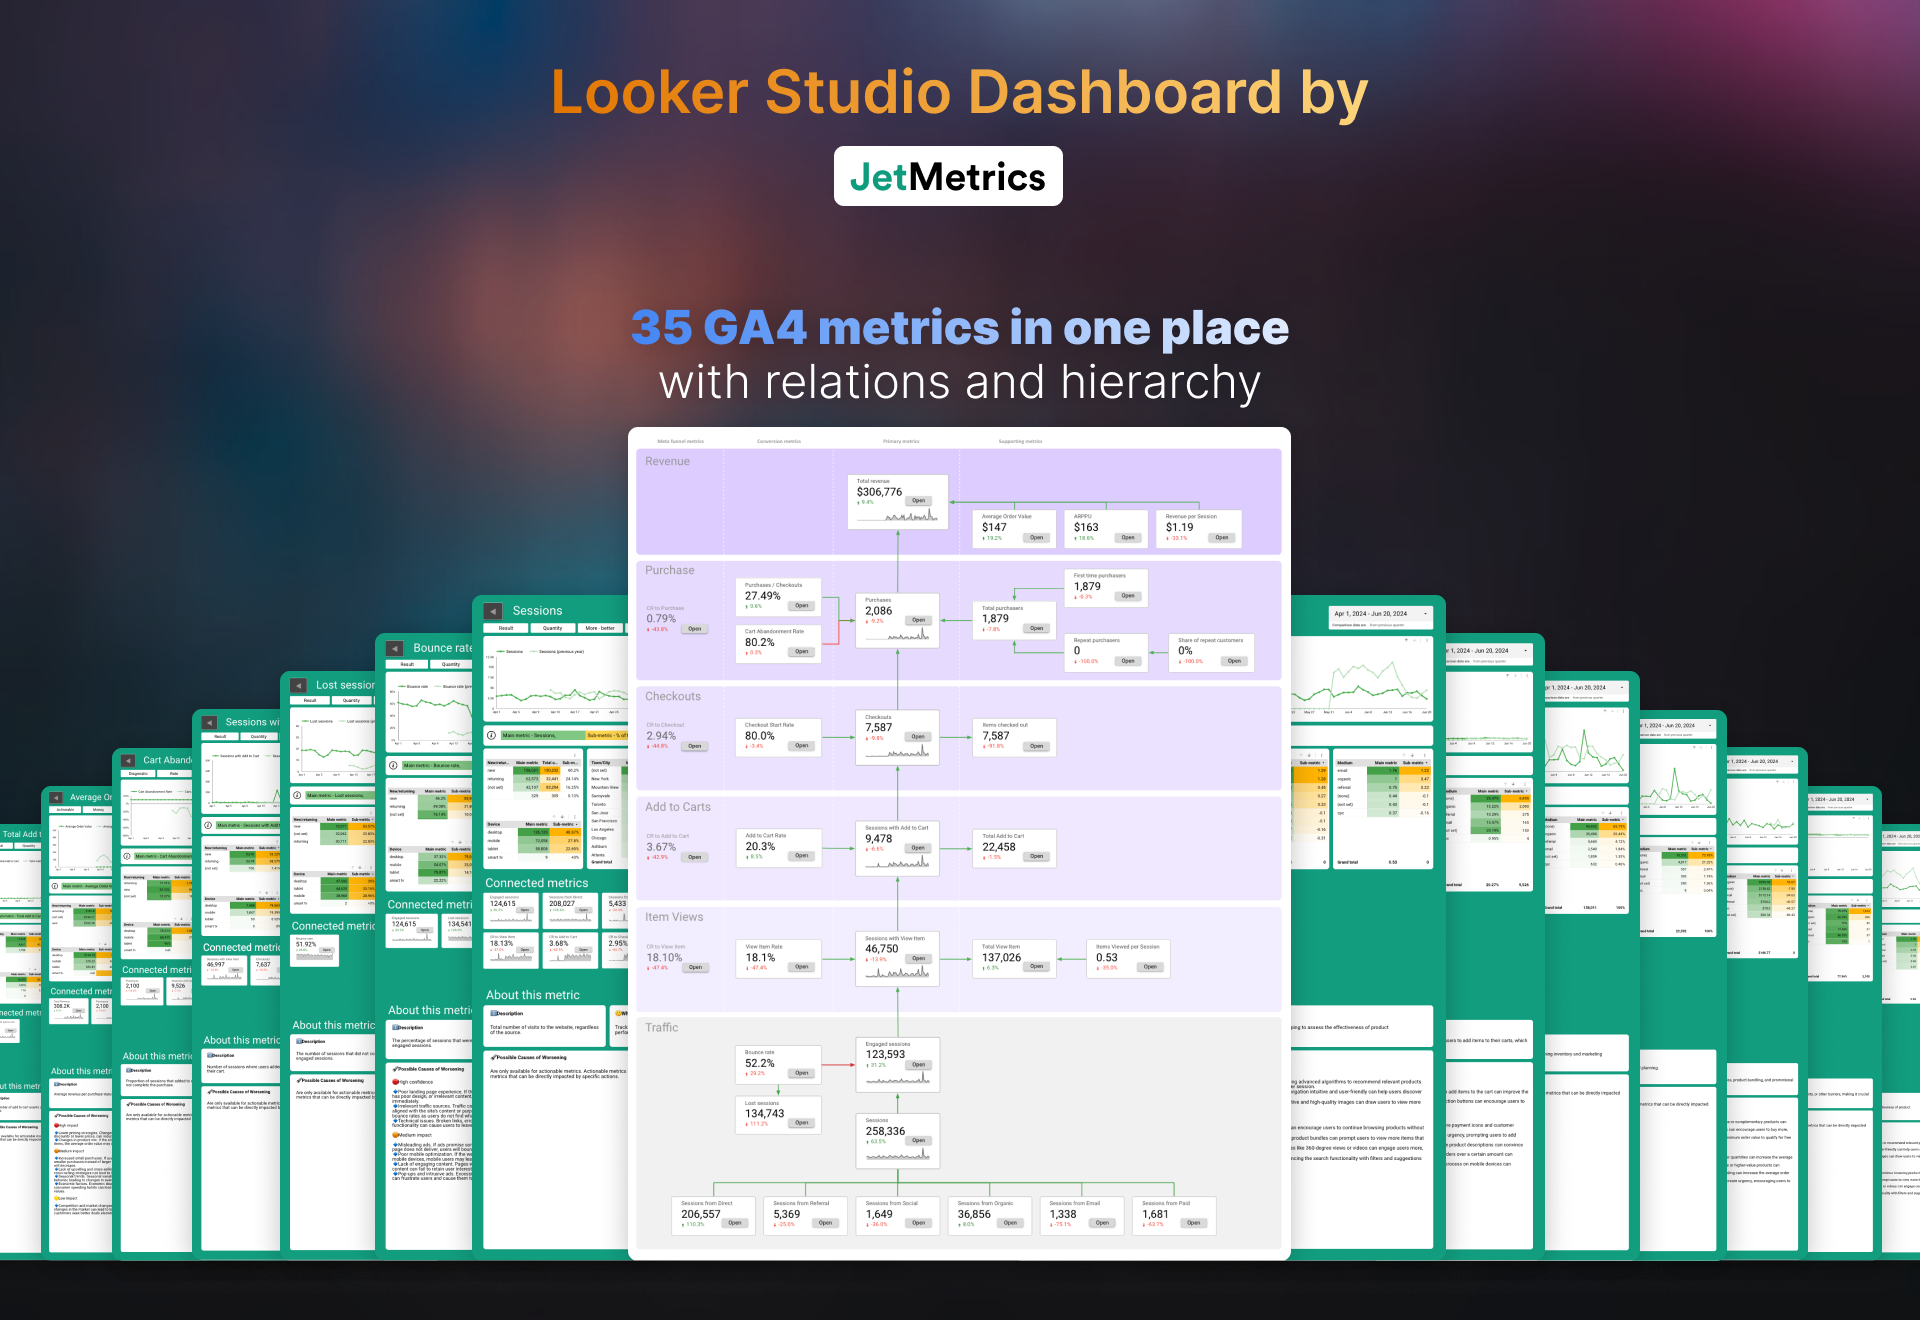
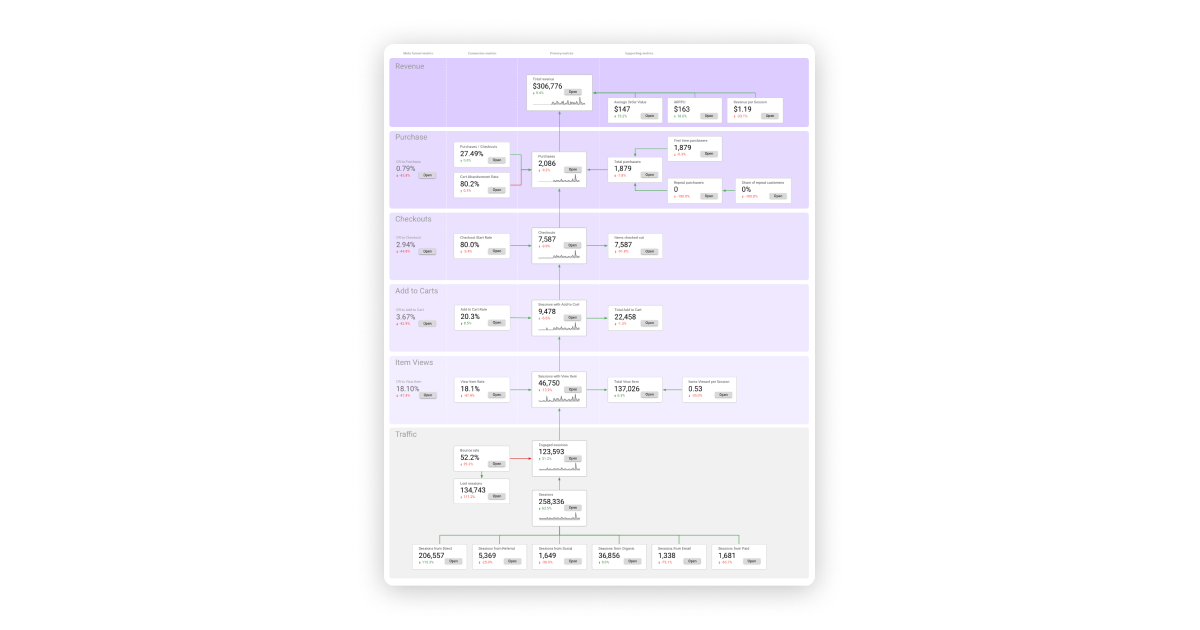
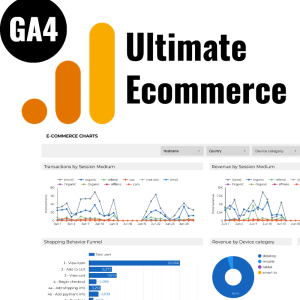
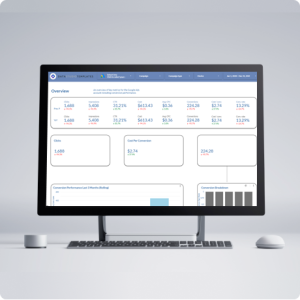
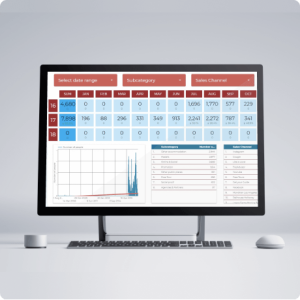
Looker Studio Dashboards by JetMetrics is a templated report on 35 major e-commerce metrics, based on the Metrics Map approach (aka Metrics Tree).

With it, you can:

  • Identify the metrics that most strongly impact sales.
  • Analyze these metrics to understand the reason for their change.
  • Discover tactics to improve these key metrics.
  • Implement tactics and test results via dashboards.

Quick Stats:

  • 1 metrics map – key e-commerce metrics
  • 1 data source – GA4 (necessarily configured e-commerce tracking!)
  • 35 metrics
  • 36 report pages
  • 56 tactics for improvement
  • 56 causes of worsening
  • ∞ times you can copy this report and plug in data from different sites
  • 141 hours it would take to develop such a report from scratch
    • Total Revenue
    • Average Order Value
    • ARPPU
    • Revenue per Session

      🗂️ What metrics are included?

      Traffic Metrics

      • Sessions
      • Engaged Sessions
      • Bounce Rate
      • Lost Sessions
      • Sessions from Direct
      • Sessions from Referral
      • Sessions from Social
      • Sessions from Organic
      • Sessions from Email
      • Sessions from Paid

      Item Metrics

      ❗view_item must be marked as a key event❗

      • Sessions with View Item
      • Items Viewed per Session
      • Total View Item
      • View Item Rate
      • CR to View Item

      Add to Cart Metrics

      ❗add_to_cart must be marked as a key event❗

      • Sessions with Add to Cart
      • Total Add to Cart
      • Add to Cart Rate
      • CR to Add to Cart

      Checkout Metrics

      • Checkouts
      • Items checked out
      • Checkout Start Rate
      • CR to Checkout

      Purchase Metrics

      ❗purchase must be marked as a key event❗

      • Purchases
      • Total Purchasers
      • First time purchasers
      • Repeat purchasers
      • Share of Repeat Customers
      • Purchases / Checkouts
      • Cart Abandonment Rate
      • CR to Purchase

      Revenue MetricsRevenue Metrics

      • Total Revenue
      • Average Order Value
      • ARPPU
      • Revenue per Session

    📄 What does a metrics page include?

    Analytics

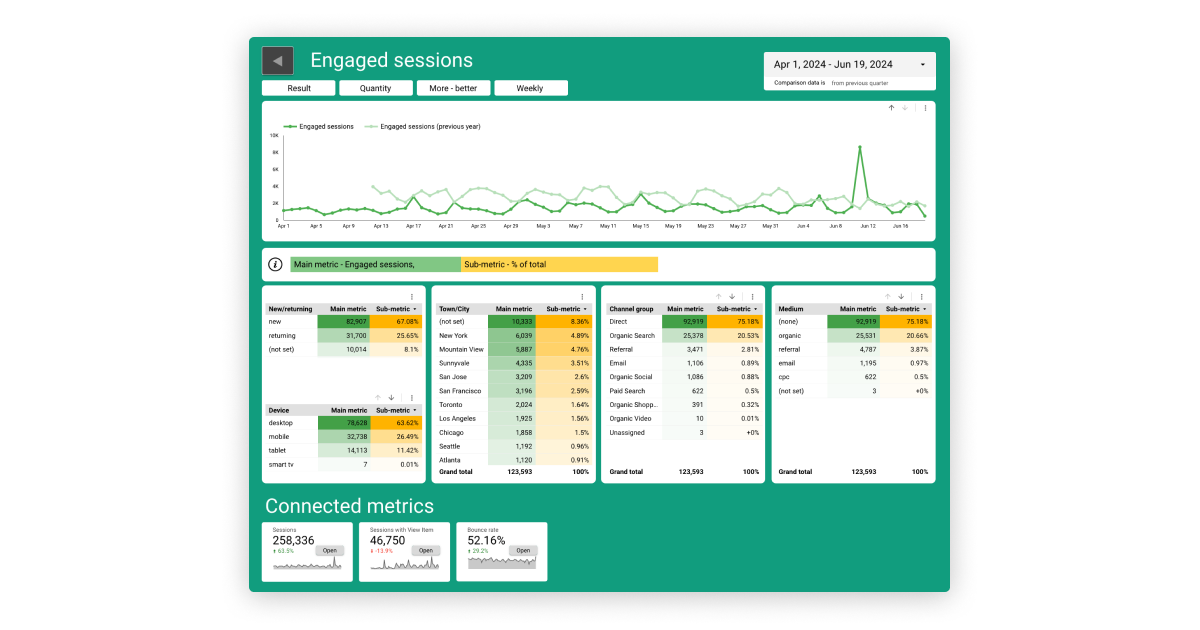
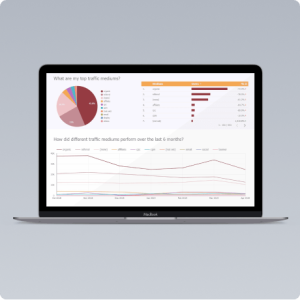
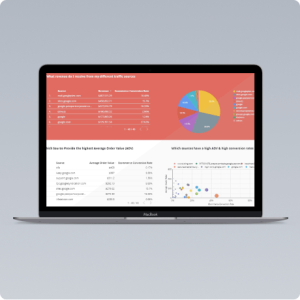
    📈 Trend graph (historical data)

    📊 Slice charts by:

    • New and Returning Users
    • Device + Platform
    • City
    • Channel + Medium
    • Source + Campaign

    🔢 List of Connected Metrics
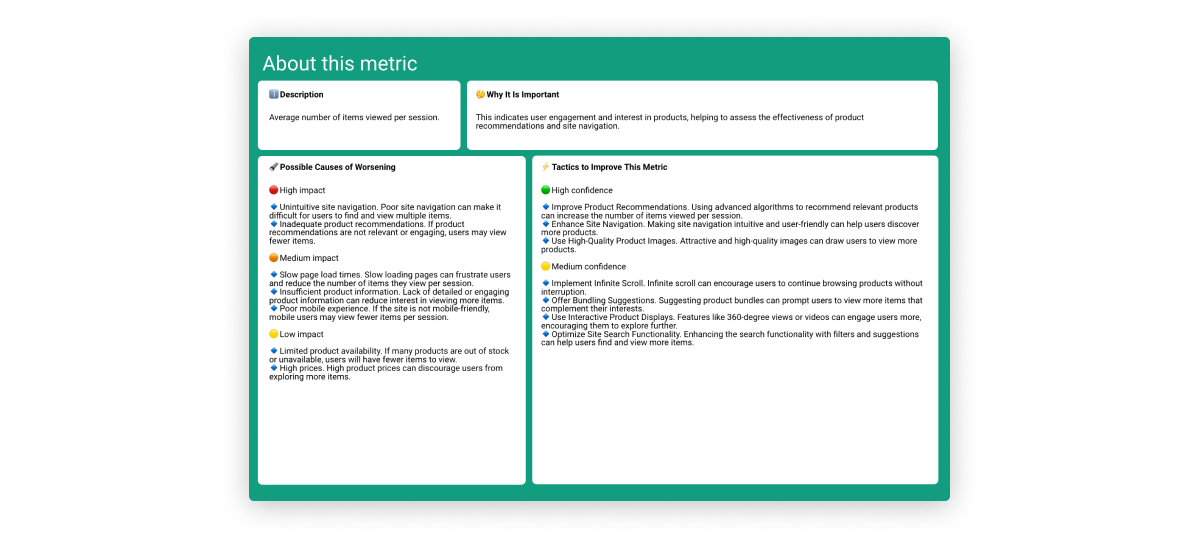
    Theory

    🏷️ 4 Tags

    👀 Description

    🤔 Why It Is Important

    🔦 7 Possible Causes of Worsening

    ⚡ 7 Tactics to Improve This Metric

Reviews (0)

Reviews

There are no reviews yet.

New Release
New Release
COPIED!

35 Key E-Commerce Metrics Dashboard

no reviews

$149.00

Instant Access – Immediately ready to roll

Setup Support – Up to 1 hr included support

Lifetime License – Yours forever to use & share

Instant access to your purchase
Built by industry experts — current marketers working in the field.
1000's of resources available today

Sell your templates!

Anyone can become a vendor and there is no sign up cost.  List your templates now and start making extra cash!

Become A Seller Today

Anyone can become a seller and there is no sign up cost.  List your resources today and start making extra cash!