Menu


View Images
Made for agencies and freelancers that focus on Google Ads and need a solution for monthly reporting.
It’s been designed primarily as a monthly report and is very comprehensive. It includes 6 pages of information on Google Ads performance and also pulls in relevant information from Google Analytics GA4.
It has a fabulous design and is able to be rebranded so it looks professional and is easy to use. It will certainly impress your clients and show them you are on top of their Google Ads!
The bottom line is that this report will be an excellent tool for any business that runs Google Ads. It’s great to look at, easy to use and contains a heap of data about your Google Ads performance. The opening summary page allows you to get a quick glance of overall performance and the following 6 pages dive down into different parts of a Google Ads account, presenting them in an easy to use interface.
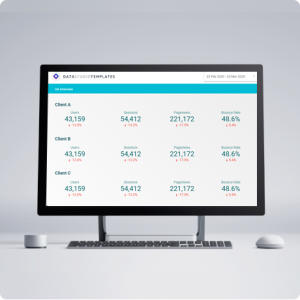
This report is particularly excellent for freelancers and agencies. It includes an area for the agencies logo, as well as the client logo. This allows it to be co-branded. It also includes text areas for the agency to include information about themselves and their services, allowing the agency to showcase extra information. The opening summary page also includes a section for commentary, making it useable as a monthly report with ongoing commentary.
Accessing your new dashboard with Looker Studio is super easy. After purchasing you will receive a link to a copyable version of the dashboard. You will also receive a link to your email. You can follow these 4 easy steps to make the dashboard yours or check out our in-depth guide:
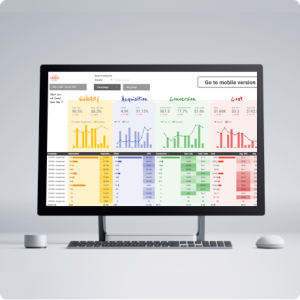
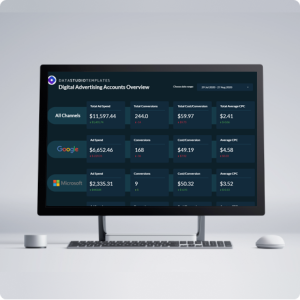
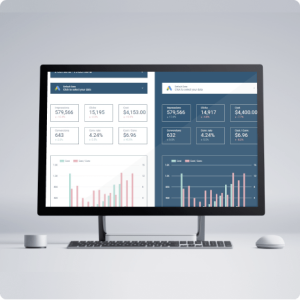
The opening page of the report is the summary page which includes an overview of performance and allows you to compare the key KPI’s for the month. The idea of the summary page is to see performance at a glance for the month and also compare performance over time. The summary page also contains space for monthly commentary. The navigation bar on the left hand side allows the viewer to navigate deeper into the report to gain more insight.
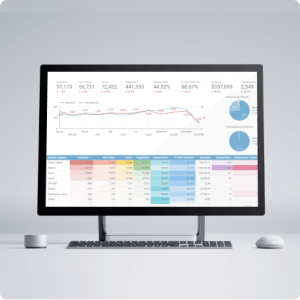
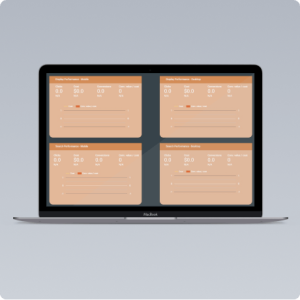
The time comparison page is naturally the next step in delving deeper into the performance of a Google Ads account. It allows the viewer to review performance over time. The top graph on this page presents monthly performance over the last 12 months allowing you to easily compare changes in cost, clicks and conversions.
The table underneath presents the same time period but includes more detailed metrics for each month allowing you to get a fuller picture of performance in the month.
Both of these graphs can be segmented by the viewer in the top bar of the report and broken down by ‘campaign type’, ‘campaign’, ‘device’ and ‘date range’.
The campaign and keyword tab contains detailed information about specific campaigns and keywords in the campaign. Noteably the ‘search query mining’ graph allows the viewer to dig through actual search queries that their ads have appeared for. This can be a great talking point during monthly meetings as you are able to walk clients through actual search terms appearing in their account and provide them a new level of transparency.
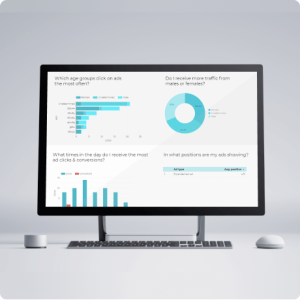
On this page of the report we can drill down into more detailed information about the users. These are the users that have interacted with Google Ads. We are able to see their locations, ages and gender. This is very useful to ensure your ad targeting is on track. It’s important to verify that your ads are appearing in front of the right users and therefore your conversion rates will be higher.
This page pulls information from Google Ads auction insights report. It’s extremely useful in comparing who else is bidding on your keywords. You are able to get a feel for where you are positioned within the Google Ads auction and scope out who are the most dominant players. This can lead to good conversations with clients around whether they need to increase or decrease their advertising spend in order to remain competitive.
The landing pages report pulls information from your Google Analytics account and shows how your landing pages are performing. These are the pages where users first land when entering your website. This is the first impression they receive. The report provides details information on these top landing pages including avg. time on page and bounce rates. The report also is able to track changes in overall landing page performance over time.
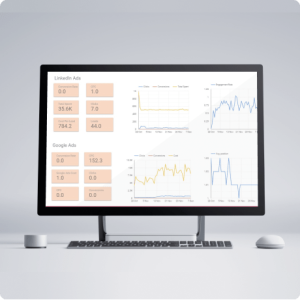
The last page in the report is the Analytics page. This page pulls in data from GA4 and is very handy to have side by side with the other Google Ads data. Analytics data provides slightly different info to Google Ads and also reports the data in different ways, due to the different attribution models that the 2 platforms use. In this comprehensive Google Ads report we’ve include key GA4 metrics as they are very useful when optimizing a Google Ads account. For example, in the bottom table we can see our Google Ads metrics side by side with other traffic sources such as bing Ads. If we have a low performing month in Google Ads it can be useful to compare this with other traffic sources to see if similar effects occured there. This can give us insight into whether this is a sitewide effect or an effect specific to Google Ads
In order to setup this dashboard we recommend adjusting the following on all pages:
One last note that the report does not contain ecommerce tracking so it is not ideal for ecommerce brands. But it does report on general goal tracking.

260+ bought
View Images


Steve Calogera –
This report template was a game changer. I’m still growing, and a full-featured system like NinjaCat is cost-prohibitive for me right now, and to be frank, I suck with Data Studio. This template gave me the foundation for an agency report my clients were blown away by.
Jerome –
Works great for my agency. We send this to our clients monthly, add some notes and send off. Makes reporting quick and professional with clients. Was pretty quick to setup all the connectors, we also updated our branding on the template, which added some time but made it very professional.
Eugene –
I’ve bought this as a freelancer, as I have a few clients I work with for Google Ads and Facebook Ads, so far I’ve setup with my first client and it works really well. I will be looking into more templates like these to keep my clients updated.
Kate H. –
Problem is that all agencies might start using this, because its pretty good!
Therese –
I’ve underestimated this report from the pictures
I’ve been running a marketing agency for a long time and seen many tools. But this is a game changer. It brings a whole client campaign together. Which is often the most crucial part of a campaign.
I’m always improving, so love this dashboard.
Tinker –
A great report only needs to do a handful of things right and this thing does it. It looks great, presents the info. well, it’s not overly complicated to use. It’s good how it has a summary, which most of my clients would not go past and for those that want more they can go deeper into the report pages. It’s an easy guided way to talk through campaigns with my clients.
Brian S –
Awesome. Is there one way for SEO?
Tim_hut –
This was assigned in a digital marketing class I’m taking. Was so useful, probably one of the best parts of the course! I will be using this over and over again and will now get involved in the template building industry