Menu

View Images
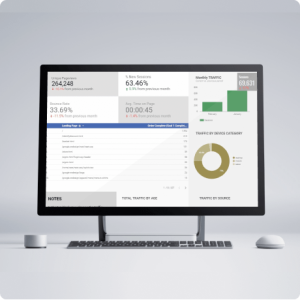
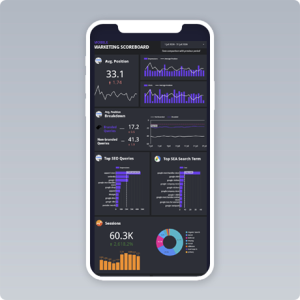
This Looker Studio (former Google Data Studio) reporting template helps you visualize data with Google Analytics 4 in a convenient way to search for insights and create reports for your clients. Note, that this template is built around Conversions as a primary goal metric, not Transactions.
All template pages contain a calendar, filters, and the ability to select Google Analytics 4 properties available on your Google account.
The Google Analytics calendar and connector work at the report level – the data specified in them on one page will be applied to all pages of the template.
All pages have a default data range for this year.
Otherwise, they are different.
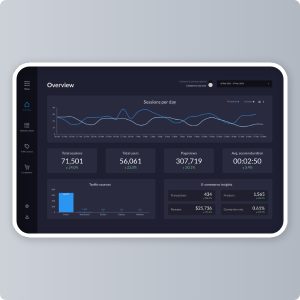
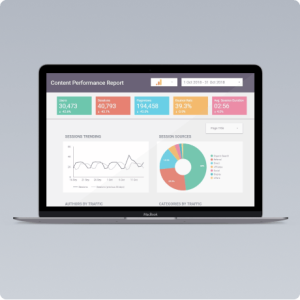
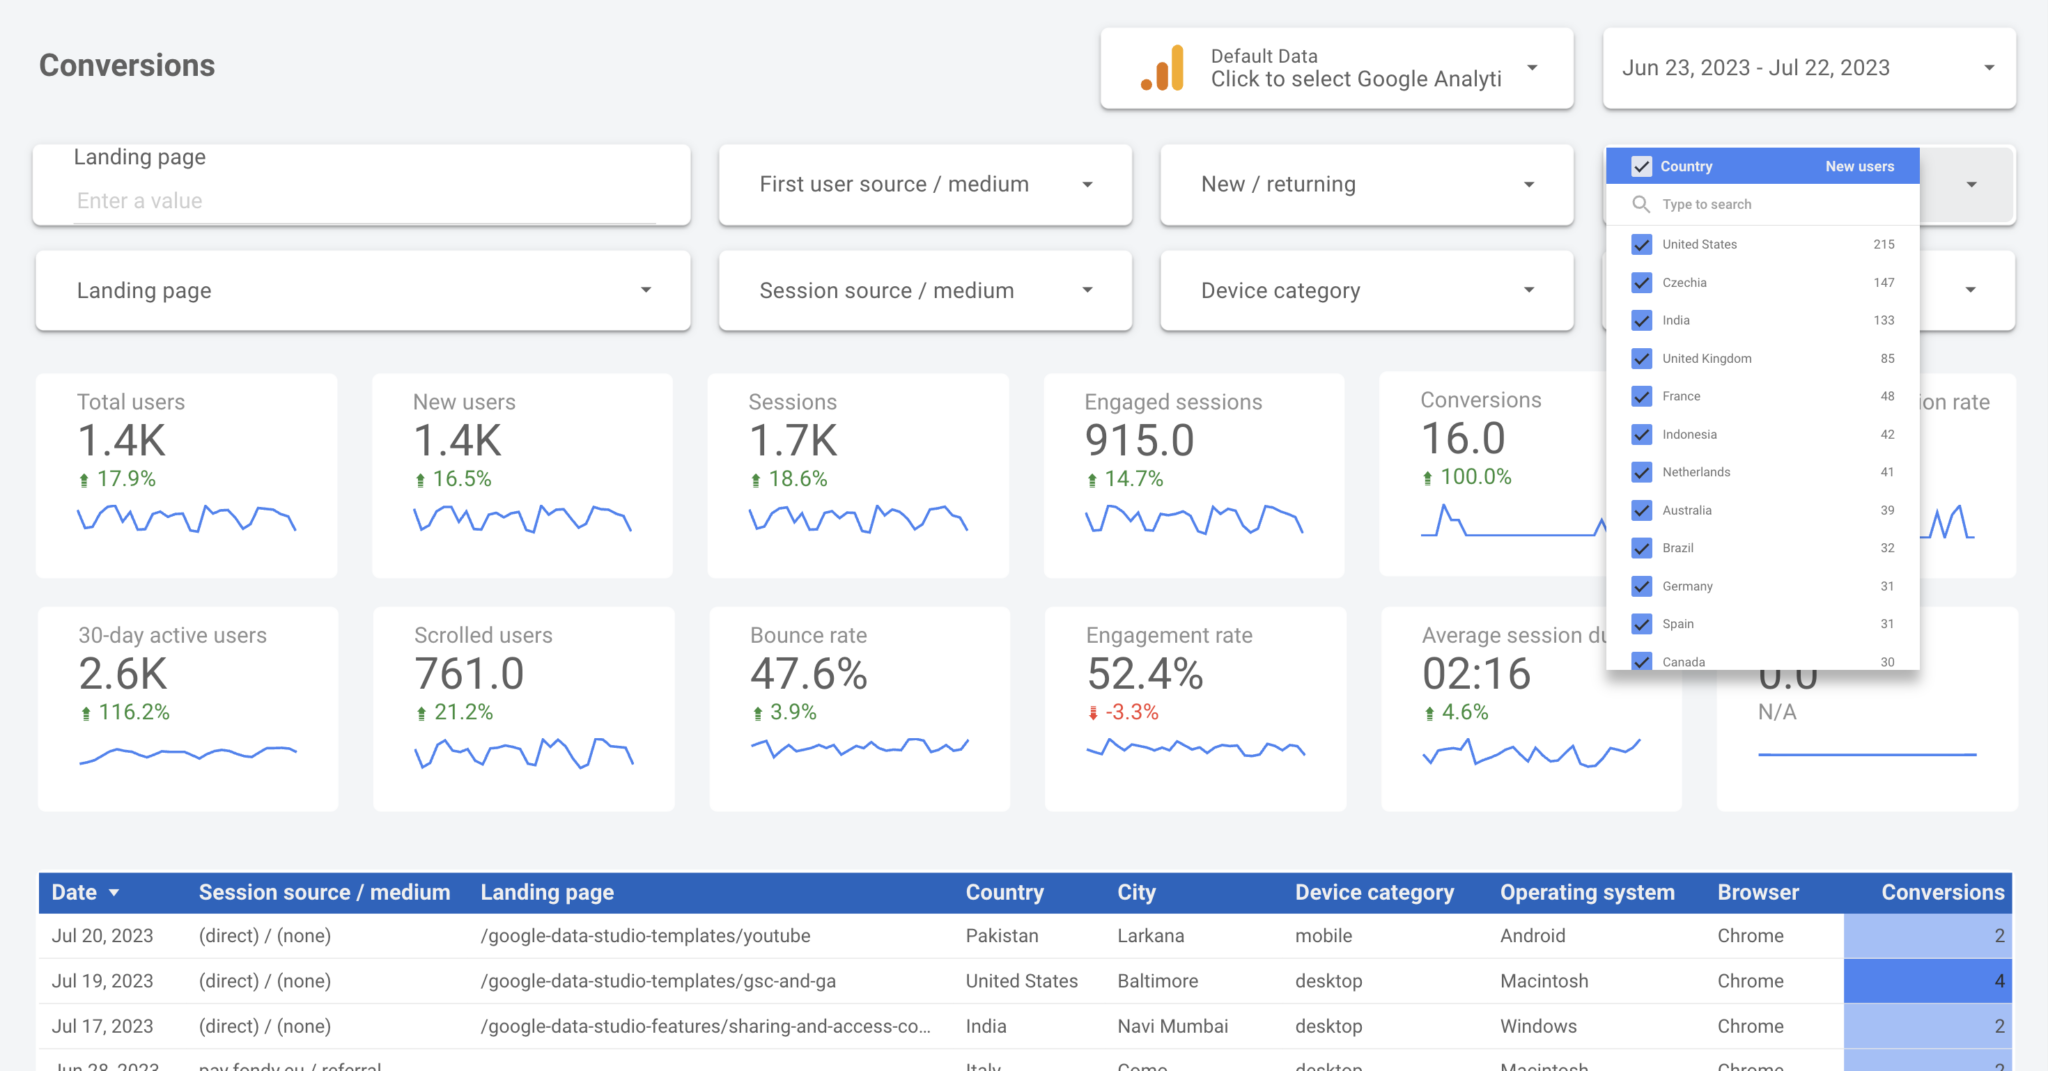
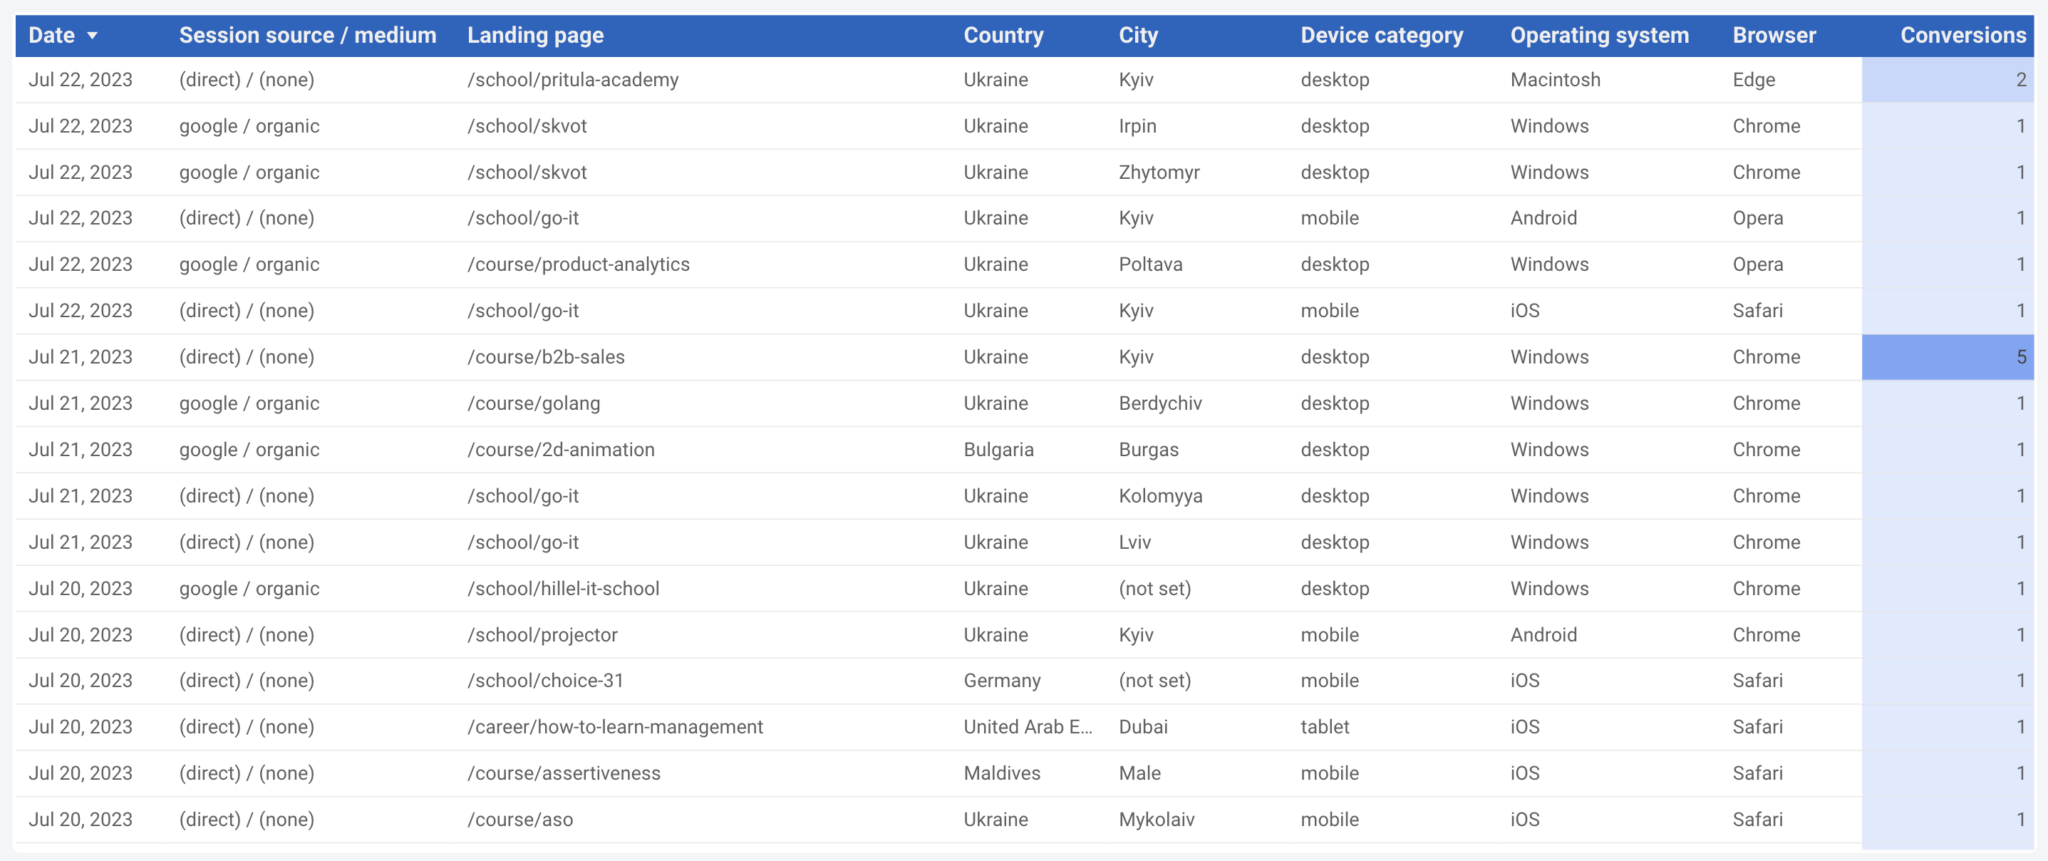
1. Conversions
Consists of three thematic blocks. The first is a table with the characteristics of users who have recently reached the conversion. This is valuable for those who like frequently update their statistics or check how certain changes on the site were reflected in the conversion.
The second block is a summary of the main success metrics in tables and charts by dates, weeks, and months. You can also change the metrics you want to view on the charts.
This block makes it possible to look for trends in the fall or rise of key metrics from different heights of time.
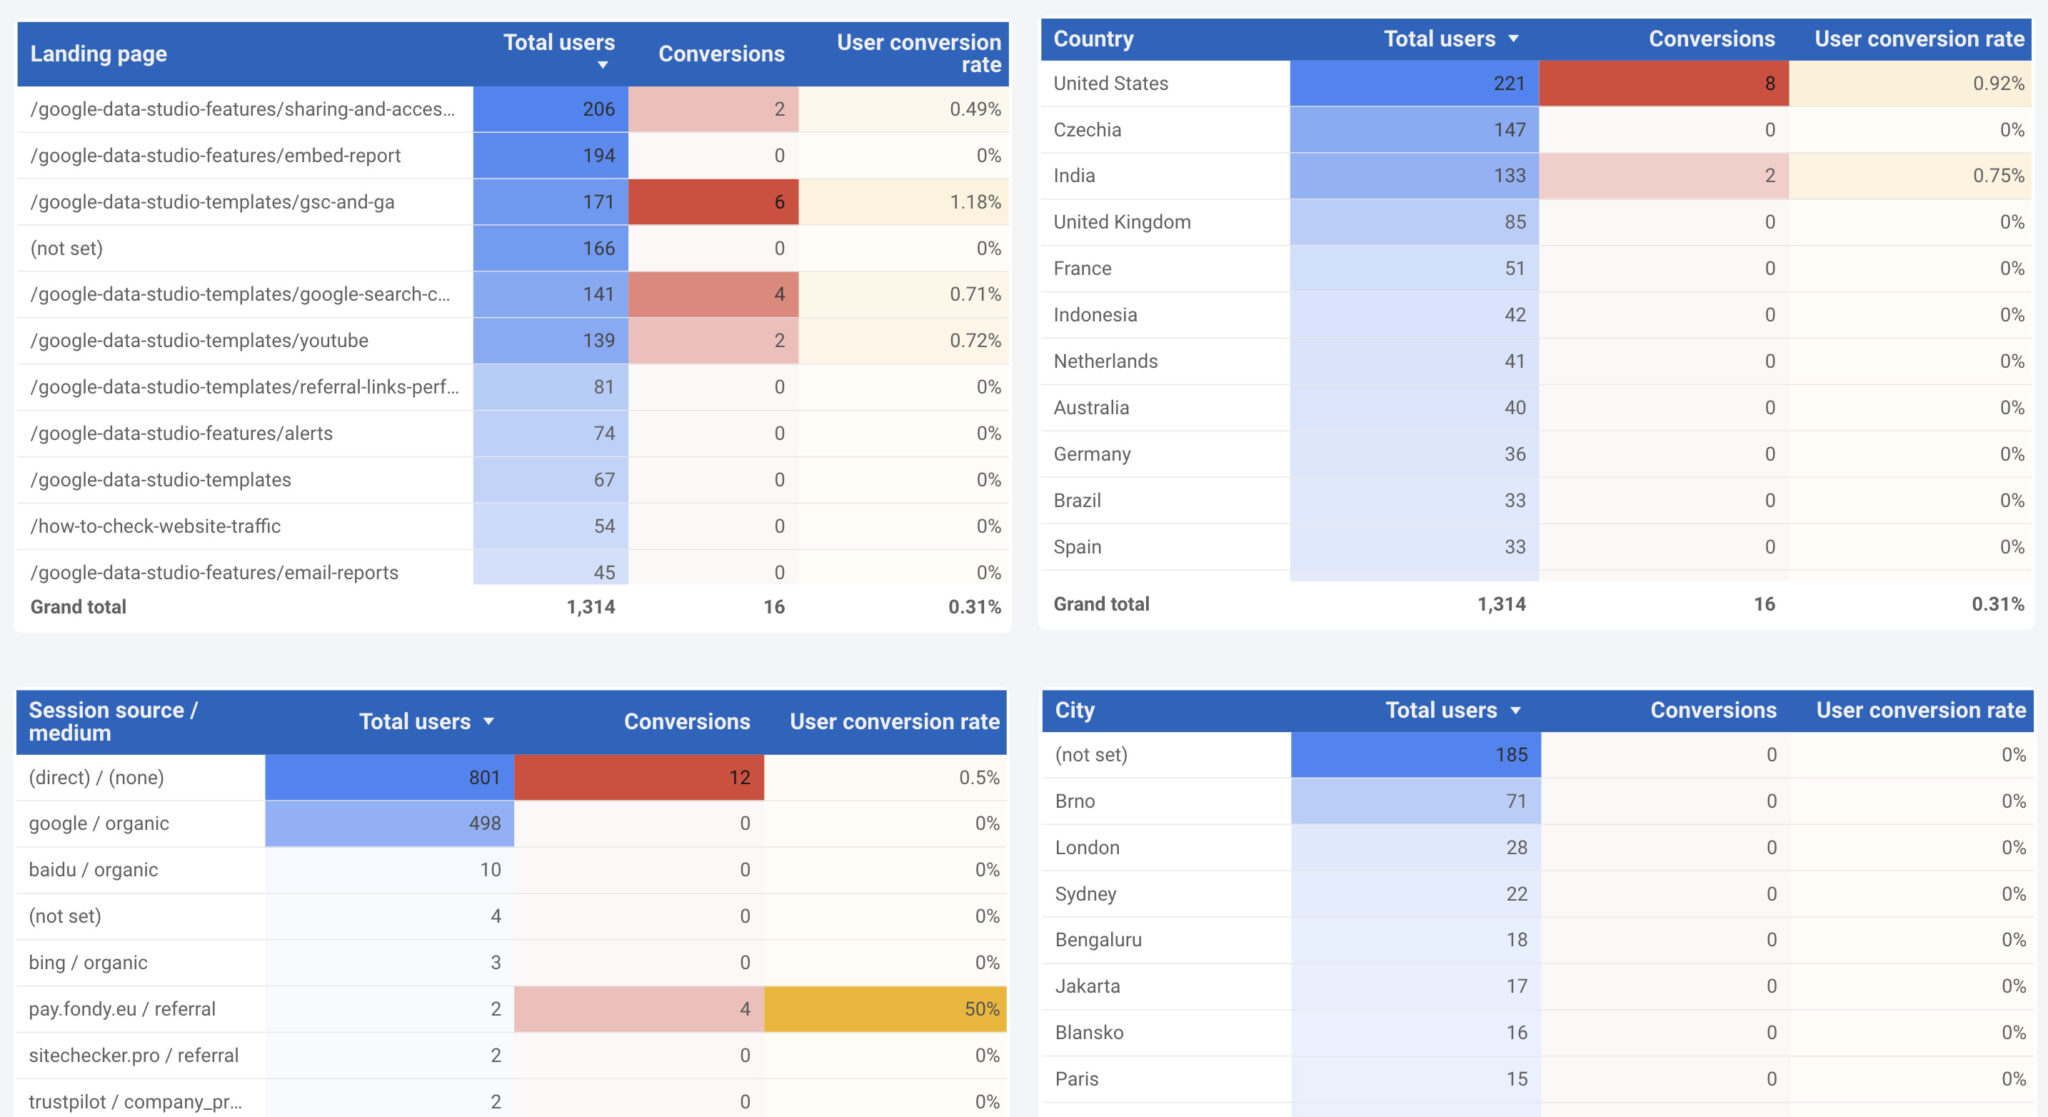
The third block is static tables with an assessment of the effectiveness of various types of parameters: which landing pages, countries, sources, devices, etc bring the most conversions.
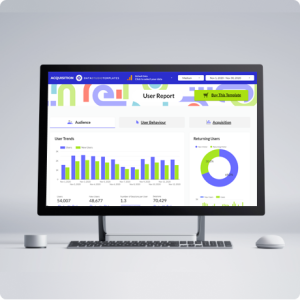
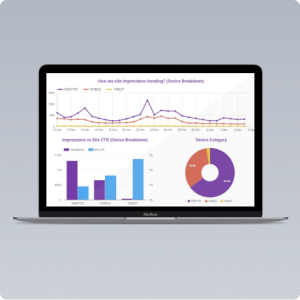
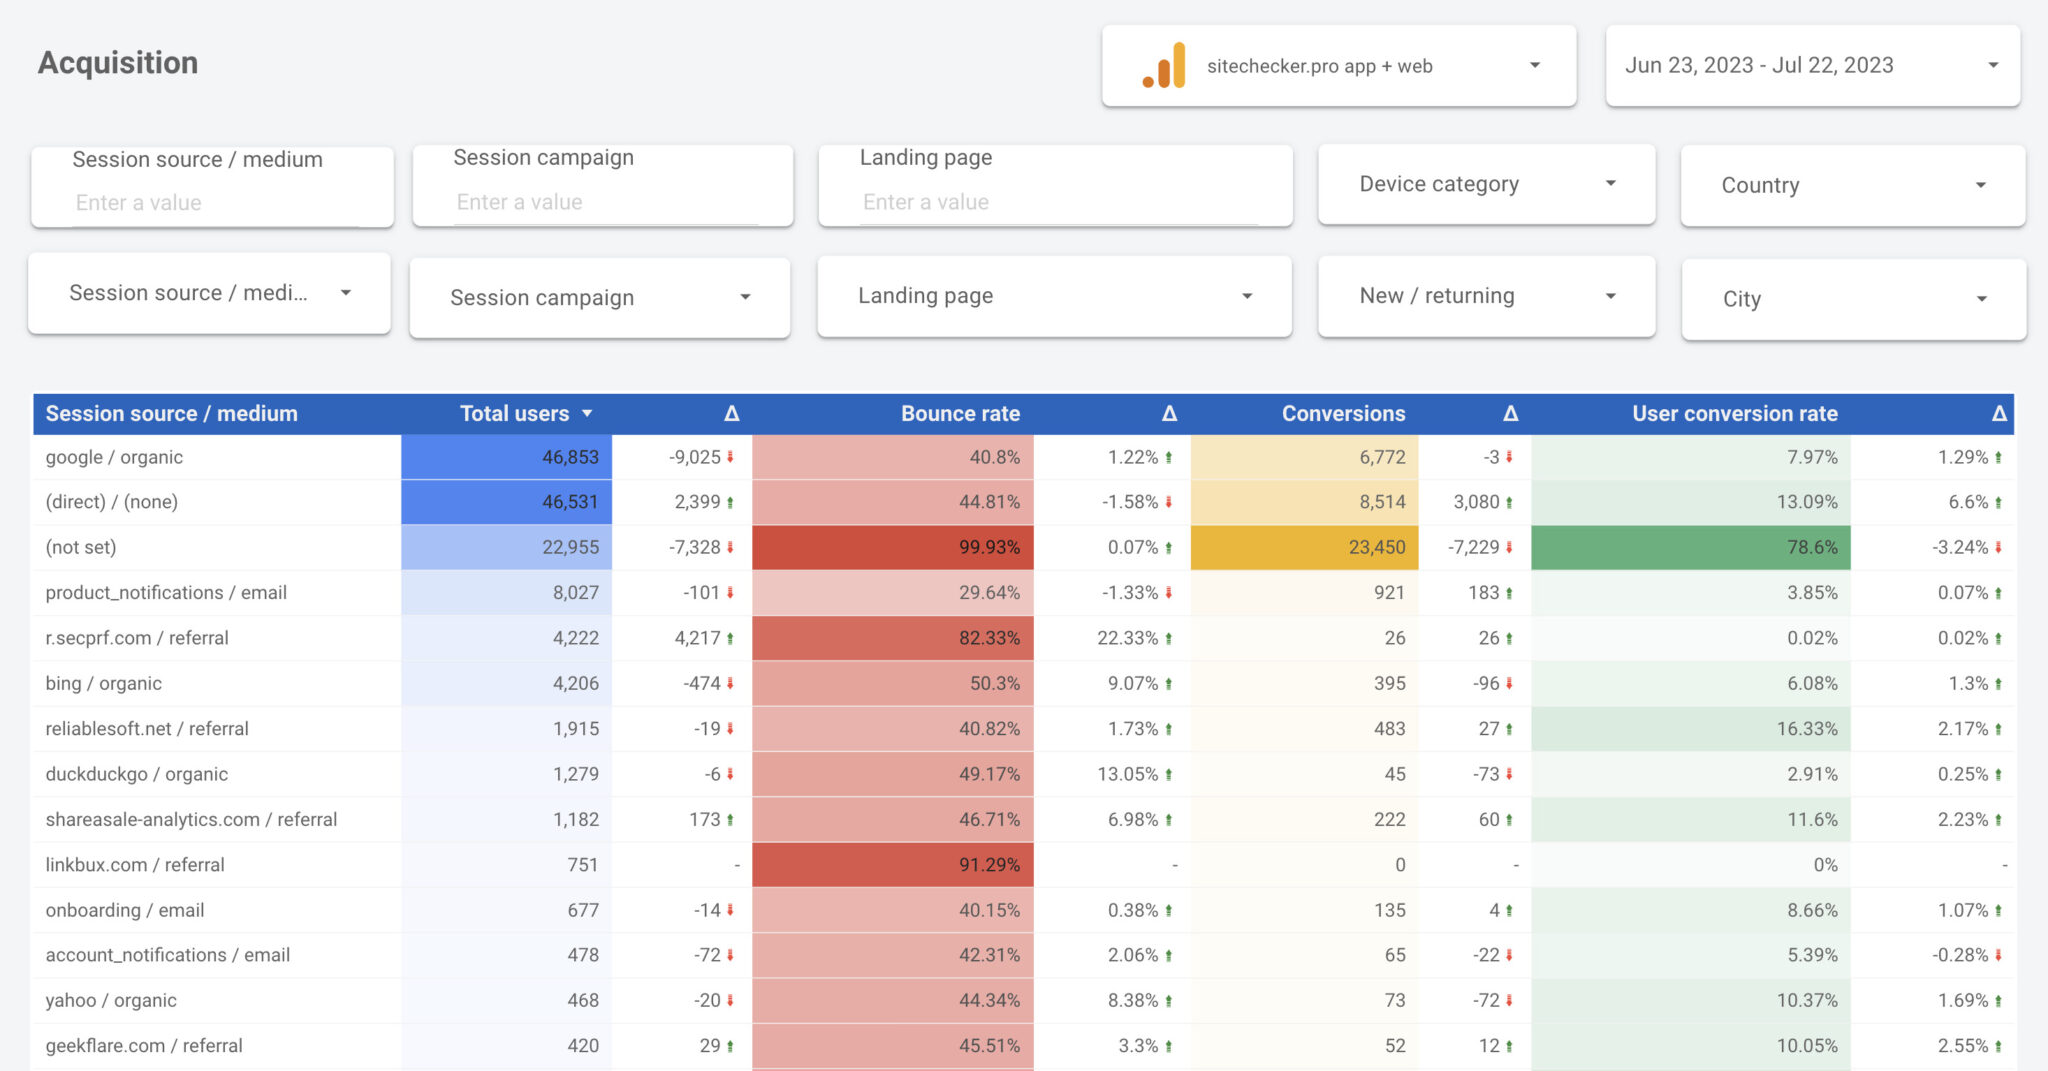
2. Acquisition
A table for assessing the effectiveness of traffic sources with delta changes in absolute numbers.
Unfortunately, in Looker Studio you cannot sort a table by delta. If this function is important to you, then export the table in Google Sheets and sort it already there.
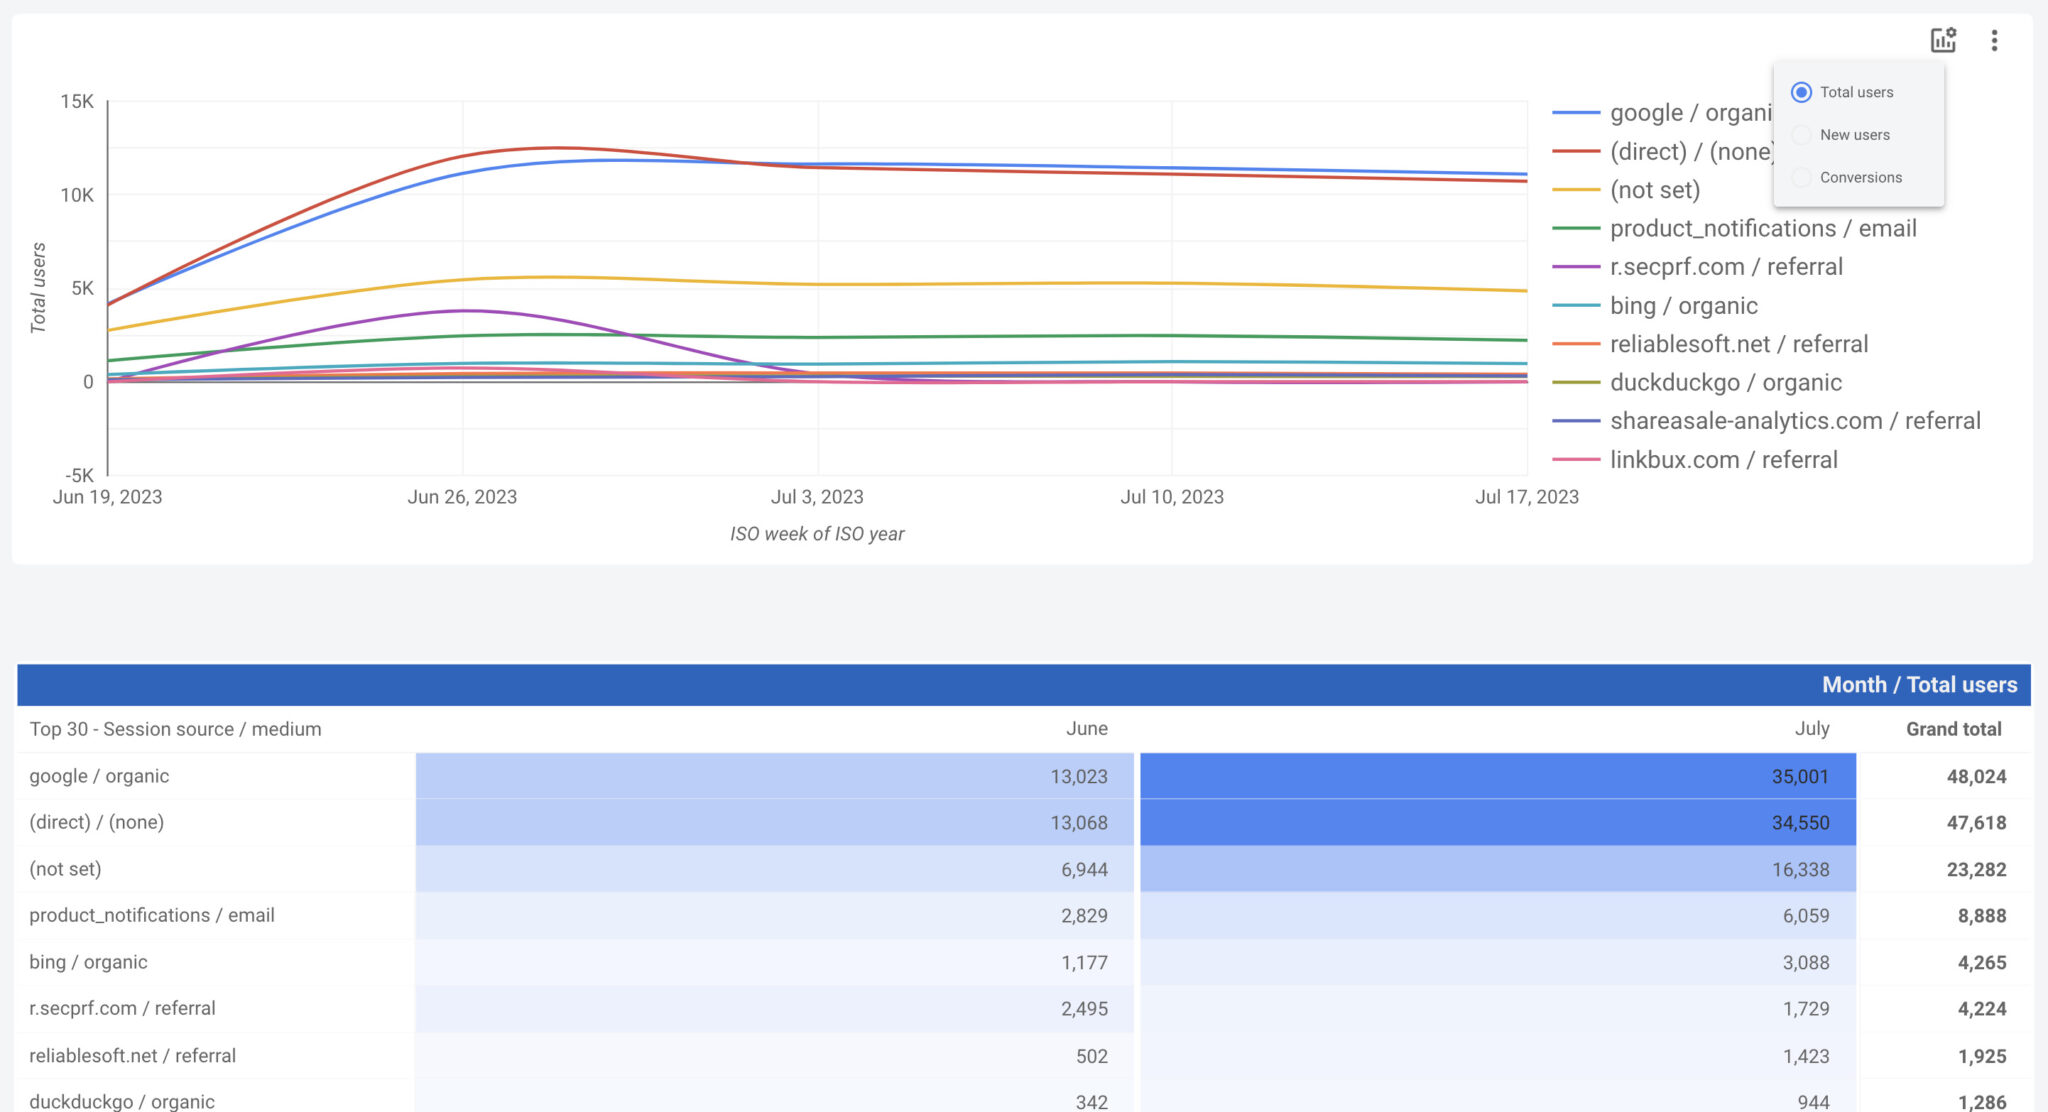
Next are the graphs and the corresponding pivot tables:
You can also change which data to display on the chart, but the sorting of parameters will remain the same. For example, in the graph below, you can choose to view the dynamics of users by the most effective sources to achieve goals.
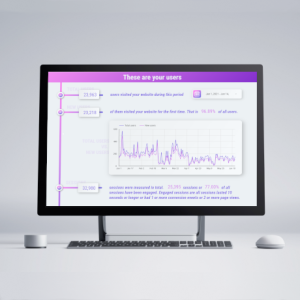
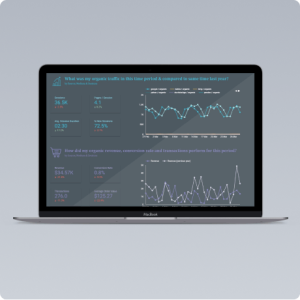
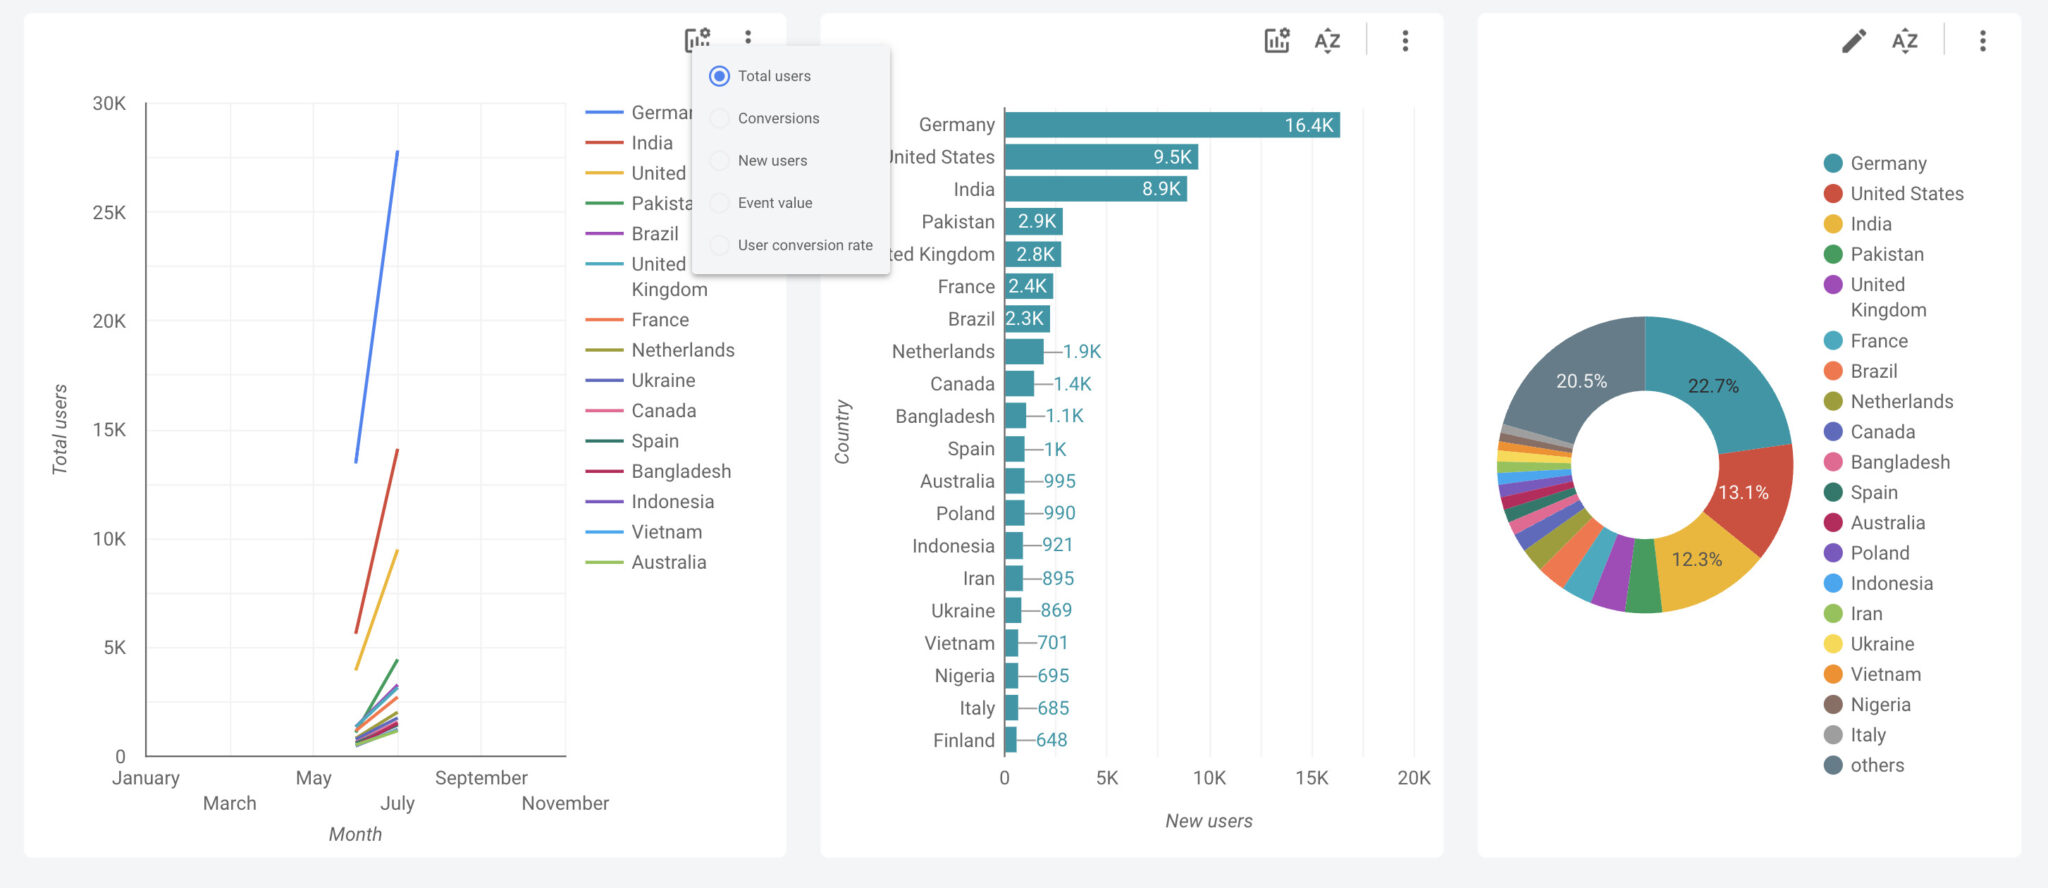
3. Audience
Here, the entire page consists of three types of graphs for each audience parameter:
On the first and second chart views, you can also change metrics in two clicks.
20+ bought
View Images