Menu


Facebook might be getting old but it’s still the most popular social media platform in the world with an estimated 2.93 billion active users. To put that into context, that’s almost 37% of the world’s population. Using Facebook Ads for your brand has the potential for huge reach and revenues. And to make sure you’re on the right path, tracking your performance is essential. One of the best tools for that is Google Sheets.
Read on to find out why and how to connect Facebook Ads to Google Sheets.
There are some serious benefits to tracking and analyzing your Facebook Ads performance. Here are some of the biggest.
Power My Analytics (PMA) and Supermetrics are third-party connectors you can use to import and analyze your marketing data. They link up to dozens of popular platforms like Facebook Ads. And they integrate with Google Sheets, Google Looker Studio and more. By using them, you can make custom spreadsheets and reports to meet the needs of your brand.
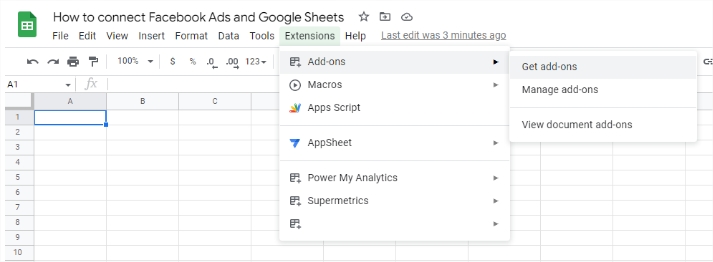
Before you can start analyzing your data, you need to install the add-ons for both Supermetrics and PMA. Luckily, it’s really easy to do. Access the ‘Extensions’ menu in the Google Sheets ribbon. Click ‘Add-ons’ and then ‘Get add-ons.’
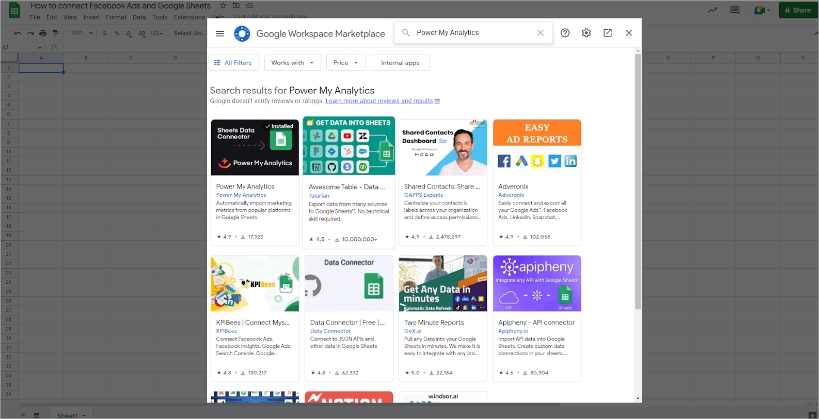
Next you’ll see a search bar. Enter ‘Power My Analytics’ and ‘Supermetrics’ and install the add-ons. After doing this you’ll need to log in and give the necessary permissions. Note: To use the add-ons you’ll need a subscription. Luckily, both PMA and Supermetrics have free trials so you can try before you buy.
Below are the steps you need to follow to get your Facebook Ads data in Google Sheets.
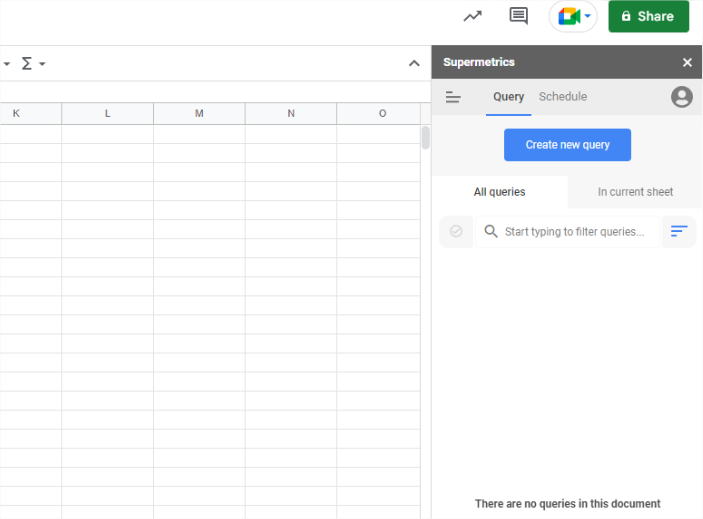
Access the Supermetrics add-on in the extensions menu. Launch the sidebar and we can get working on your first query. To get started, click ‘Create new query.’ Now you’ll see all of the different data sources Supermetrics connects to. For this demo, we’re using Facebook Ads. So search for Facebook Ads and click the icon. Next, log into your Facebook Ads account and give the required permissions to Supermetrics.
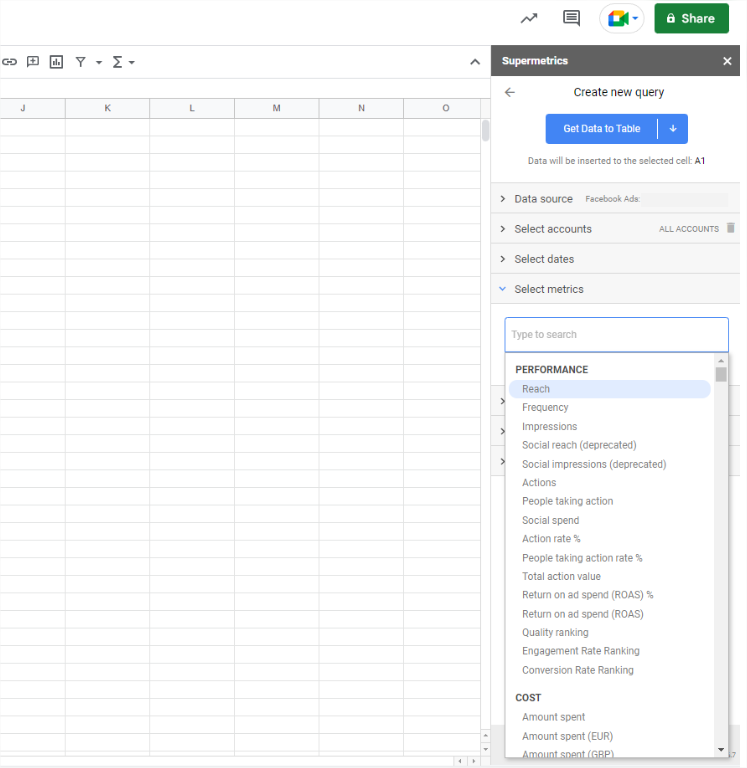
Now it’s time to configure the query. Choose the account, select the timeframe, and add the metrics you’d like to analyze. Then choose the dimensions you’d like to split the metrics by. Click the blue ‘Get Data to Table’ button and Supermetrics will send the data to the spreadsheet.
Now your spreadsheet includes data, you can start analyzing it. Start by adding the best charts for your data type. For more on graphs and charts, take a look at our ultimate charts and graphs guide.
Now let’s take a look at how to connect Facebook Ads to Google Sheets through PMA. There are three steps you need to follow.
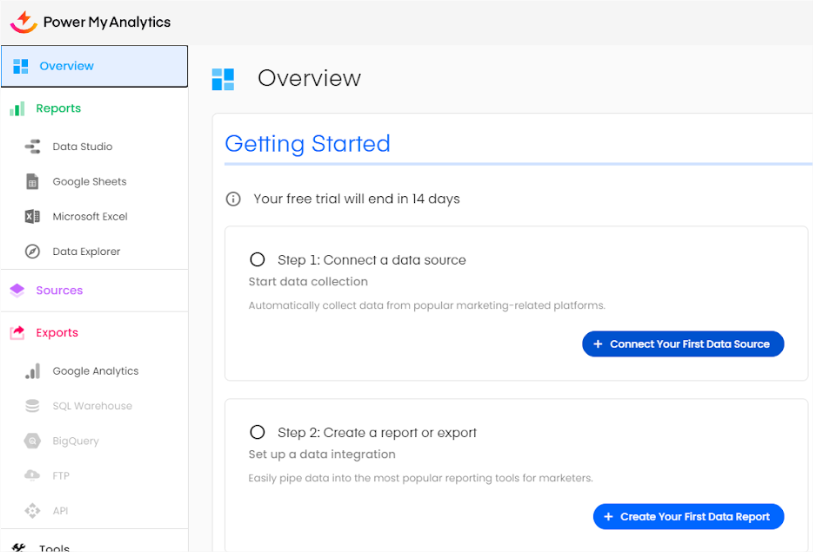
Before we can start using the add-on in Google Sheets, first we need to add a data source. To do this, go to Power My Analytics and log in. In the overview, you’ll see this screen. Click ‘Connect Your First Data Source.’ Find ‘Facebook & Instagram,’ follow the prompts, give the permissions, and you’re all set.
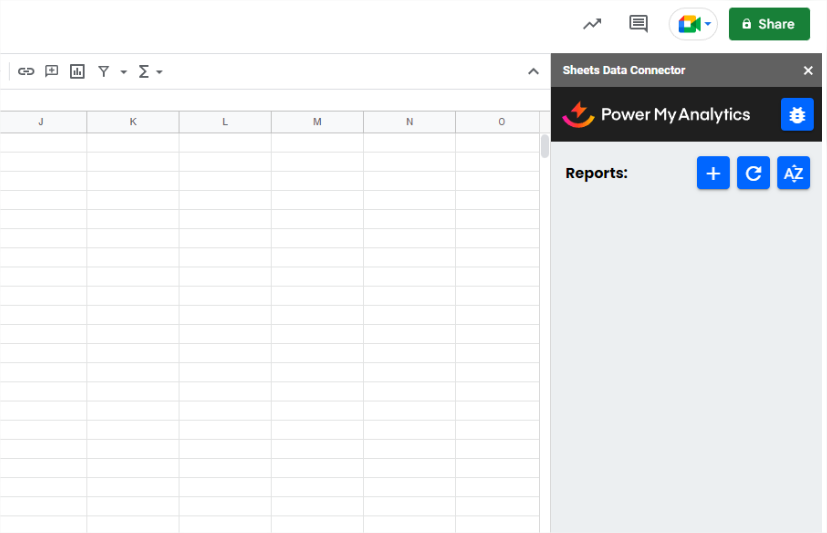
Let’s go back to Google Sheets. You can access the PMA add-on in the ‘Extensions’ menu. Click ‘Show Sidebar’ and it’ll pop up on the right side of the screen. Here we need to set up our first report. To do this, click the plus icon. Search for the Facebook Ads connector. Then select the right accounts.
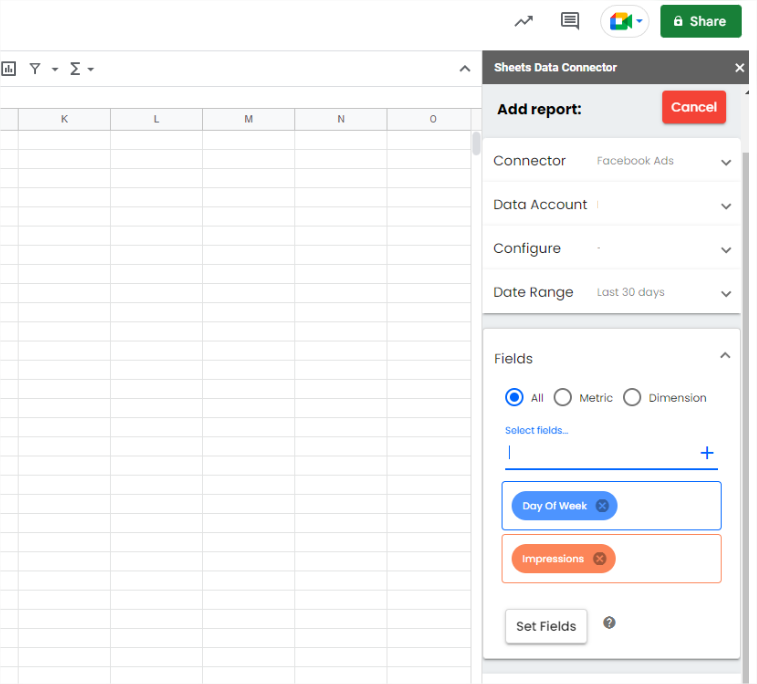
Next we need to tell PMA what data we want to analyze. Select the date range for your analysis. Choose the dimensions and metrics. Add a filter and, finally, give your report a name. Click ‘Create Report’ and PMA will populate your spreadsheet with the right data.
Now you should have a table full of data about your Facebook Ads performance. You can use Google Sheets features to analyze and visualize your data. Take a look at our advanced data visualization tips to help you get the insights you need.
Finally, there’s one last way to connect Facebook Ads to Sheets. This is the simplest method — it’s pretty old school with no automatic data refreshing. This means that although it’s free and easy to do, it’s the least flexible option. Here’s how it works.
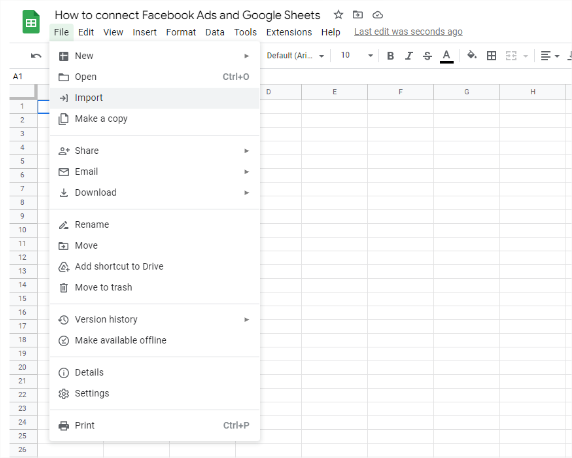
In your Facebook Ads account, click ‘Reports’ in the top right corner. Then select ‘Export table data.’ Next you’ll have the option to download a .csv or an Excel file. Choose the file type you want and click ‘Export.’ Now it’s ready to import into Google Sheets. In the ‘File’ menu click ‘Import’ select the file you just downloaded from Facebook Ads and you’re all set. Just remember that as there’s no automatic update, you need to follow this process every time there’s a change to your data set.
Facebook Ads charges based on cost-per-click (CPC) and cost-per-mile (CPM). It’s hard to say exactly how much an ad will cost because seasonality and competition are a big part of the calculation. But on average, $0.94 for CPC and $12.07 per 1,000 impressions (CPM). For more help budgeting for the Facebook Ads auction check out this Google Sheets budget pacing template.
Google Sheets is Google’s spreadsheet. Because it’s browser-only, you can access it anywhere on any device. It’s great for tasks such as data analysis, budget planning, and creating charts and graphs. Because it integrates with the rest of Google’s suite, it’s ideal for collaboration.
Google Sheets is perfect for analyzing Facebook Ads metrics. Here’s why:
Google Sheets is a free service. It integrates with Google and third-party tools. You can connect to Google Adwords, Google Analytics, Google My Business and more. Multiple people can access and work in the same sheet at the same time. Google Sheets is easy to use. And it has a bunch of features for data visualization.
There sure are. On the byMarketers marketplace you’ll find a full range of Google Sheets resources that can help you with your marketing.

