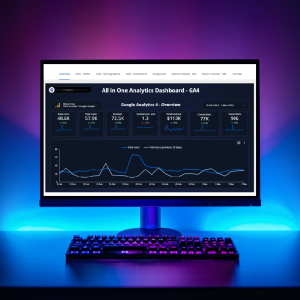
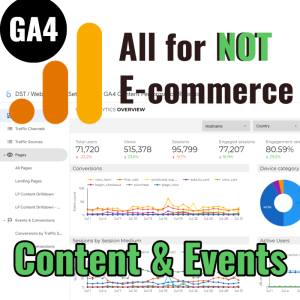
With this 10-page template you can analyze everything important on your website with data from Google Analytics 4. Access more easily to important information, with fewer clicks and better usability. Perfect for analyzing the metrics of a website on a daily, weekly or monthly basis.
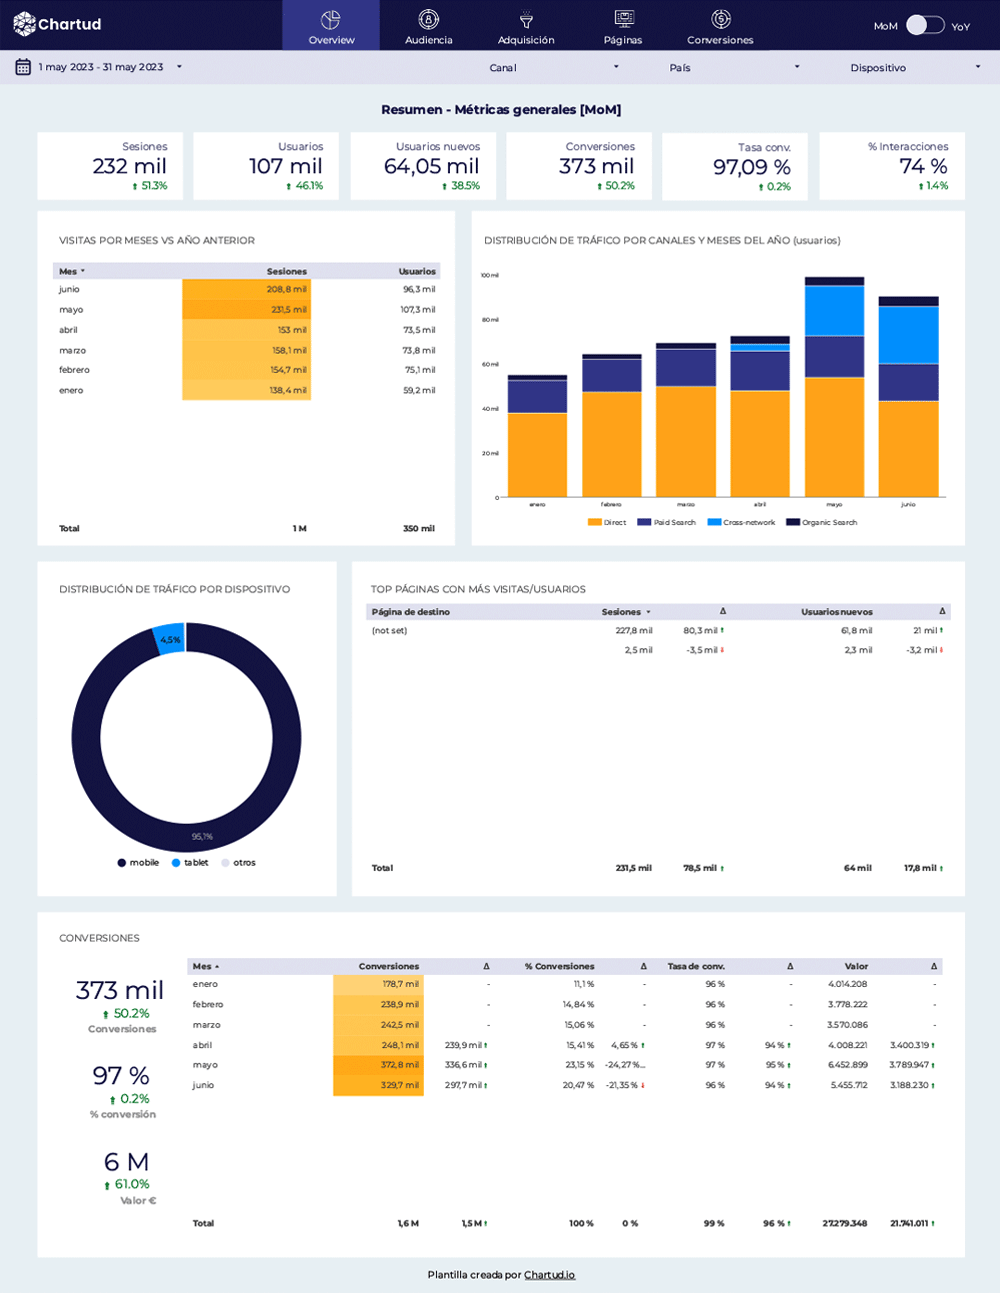
Page 1: General data (MoM)
- Analysis of users and sessions by months vs. previous year.
- Distribution of traffic by channel for the previous year or current year (eligible)
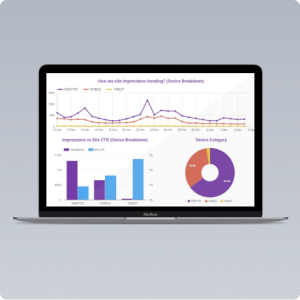
- Traffic distribution by device
- Top pages with more users/sessions vs. previous period
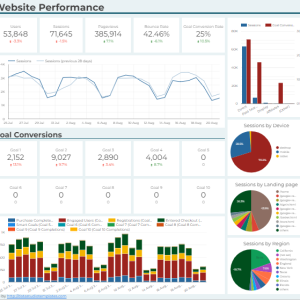
- Conversion analysis:
- Conversions, conversion rate and value vs. previous period
- Table conversions per month of the current or previous year vs. previous period
- Table with different targets per month of the current or previous year vs. previous period
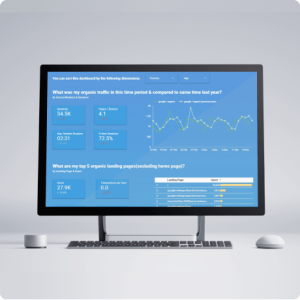
Page 2: General data (YoY)
- Same as the previous page but all compared to the previous year.
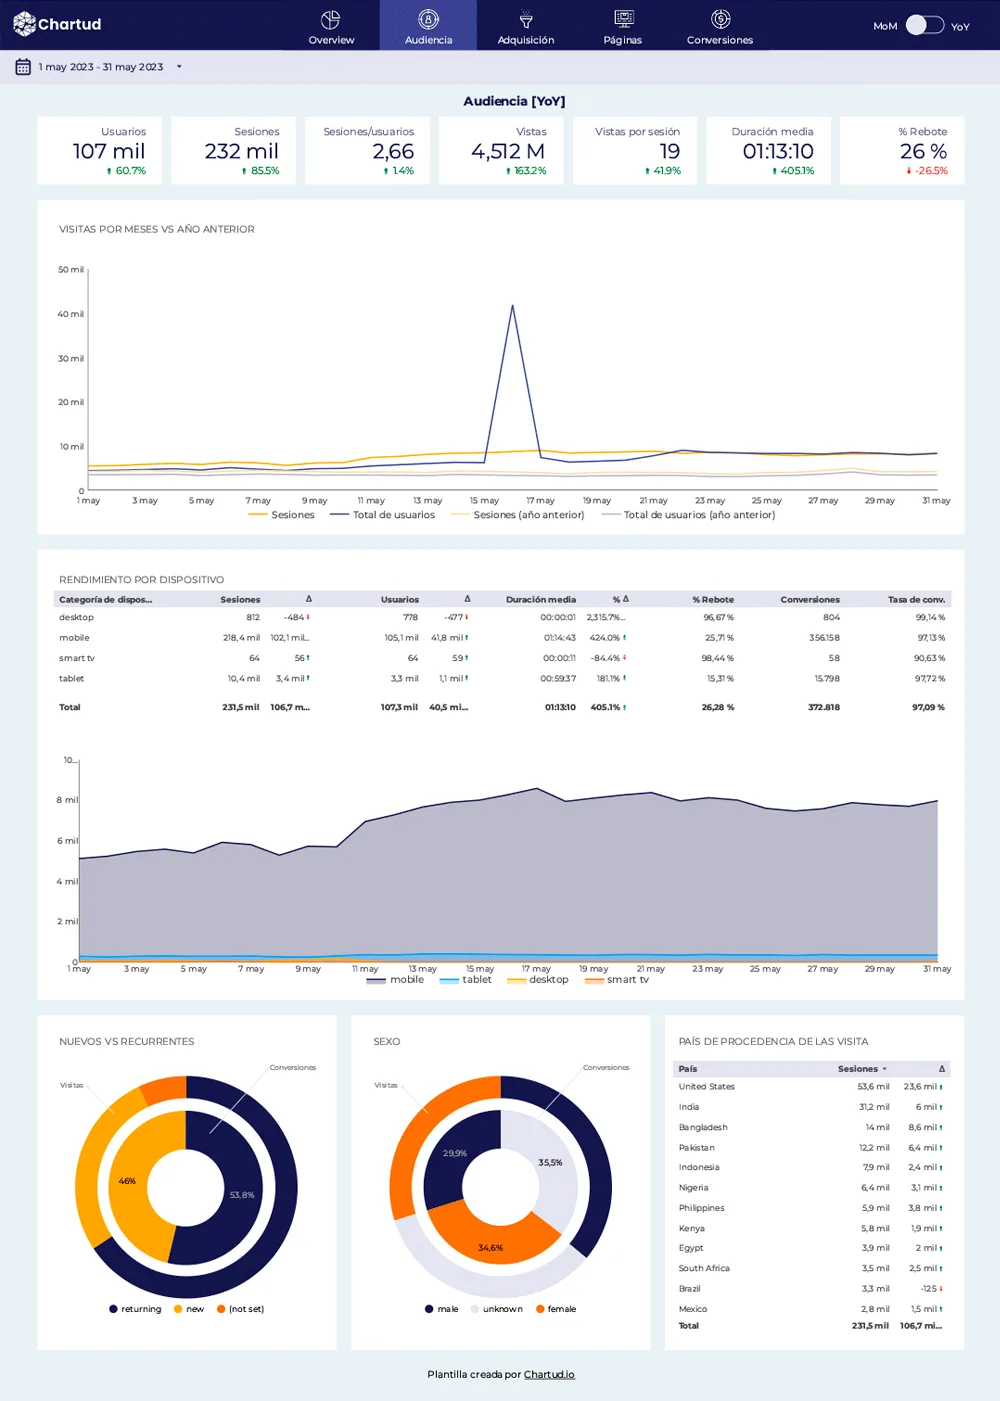
Page 3: Audience (MoM)
- Key metrics vs. previous month
- Visits by months vs. previous year (time graph)
- Performance per device with key metrics, including conversions
- Table + time chart (multifilter)
- New vs. returning visitors: sessions and conversions
- Sessions and conversions by gender
- Table with visits by country
Page 4: Audience (YoY)
- Same as the previous page but all compared to the previous year.
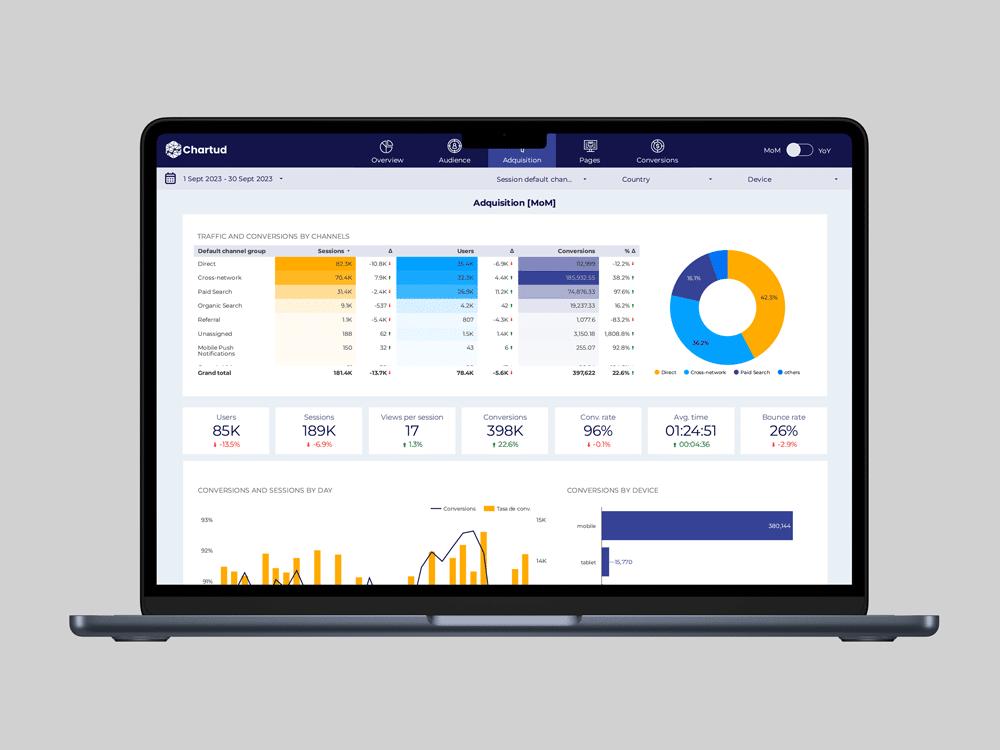
Page 5: Acquisition (MoM)
- Traffic and conversions by channels (chart + pie chart) with filter
- Top metrics by channel, conversions and rate per day (time graph) and conversions per device (bar graph) all filtered by channel
- Sessions per day (time graph)
- Top landing pages by channel (table)
Page 6: Acquisition (YoY)
- Same as the previous page but all compared to the previous year.
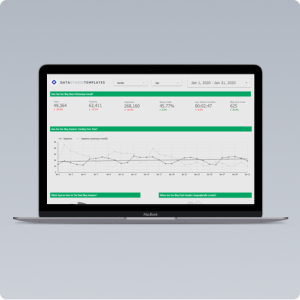
Page 7: Pages (MoM)
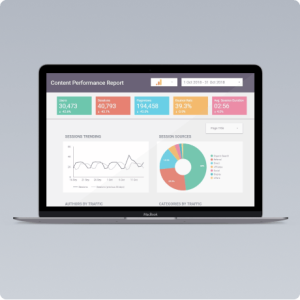
- Key metrics per page
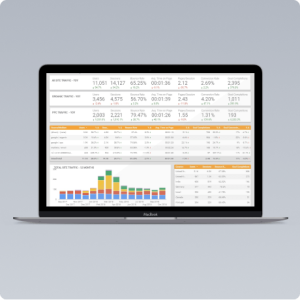
- Table with performance per page with Channels and Devices filter, plus filter to choose page(s)
- Table with performance per landing page
- Event analysis: category, action, tag. Connected tables. Select an event category with a click to view event actions and tags.
- Performance of events per page. Connected to previous table.
Page 8: Pages (YoY)
- Same as the previous page but all compared to the previous year.
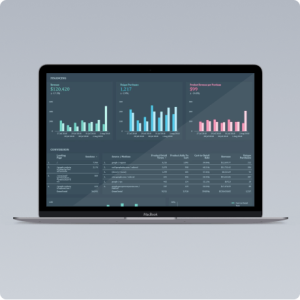
Page 9: Conversions (MoM)
- Key metrics related to conversions
- View conversions and conversion rate by day
- Channels that generate more conversions – table (you can choose which conversions you want to analyze)
- Conversions and conversion rate per channel with bar chart for faster analysis.
- Pie chart with conversions per channel.
- Conversions per landing page
- Analysis of the place where conversions take place
- Steps that users take to conversion
Page 10: Conversions (YoY)
- Same as the previous page but all compared to the previous year.
Difficulty level of adapting the template
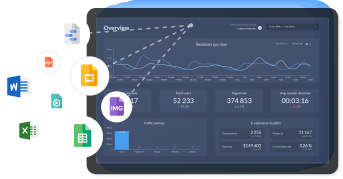
Adapt the template in 1 minute to your data. You will only have to connect your Google Analytics 4 data .
Easily customizable colors and logo. You can change the metrics and dimensions you need whenever you want, delete or add new graphs easily.


Reviews
There are no reviews yet.