Menu
Units Sold: 16
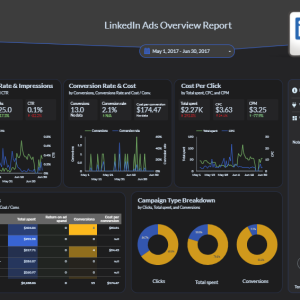
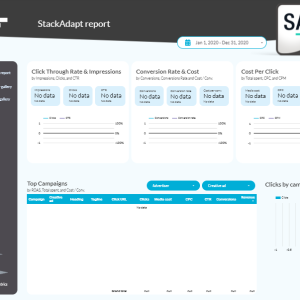
Twitter Ad’s in-built analytics are fine but where they’re lacking is visualization. Luckily, this Google Looker Studio dashboard from Supermetrics has everything you need. This one-page dashboard visualizes vital metrics like click-through-rate, conversion rate, and cost-per-click. You can analyze your campaign performance at a glance with this easy-to-use and easy-to-understand dashboard.
Not only can you see what content your audience engages most with, but graphs also show you how your metrics have changed over time. Plus, a comparison shows you how your previous campaigns stack up against each other so you can really pinpoint what works and doesn’t with your audience.
Whether you’re running ads for your own business or working with a client, this dashboard gives you the data to inform your marketing decisions. And the clear and colorful design is sure to impress stakeholders or clients.
Anyone can become a vendor and there is no sign up cost. List your templates now and start making extra cash!
Anyone can become a seller and there is no sign up cost. List your resources today and start making extra cash!
A marketplace for buying and selling original marketing resources. 1000’s of resources available, come and browse today.