Making your Salesforce dashboards tell the story you want is hard. Salesforce dashboards aren’t customizable and don’t allow you to drive the behavior you want.
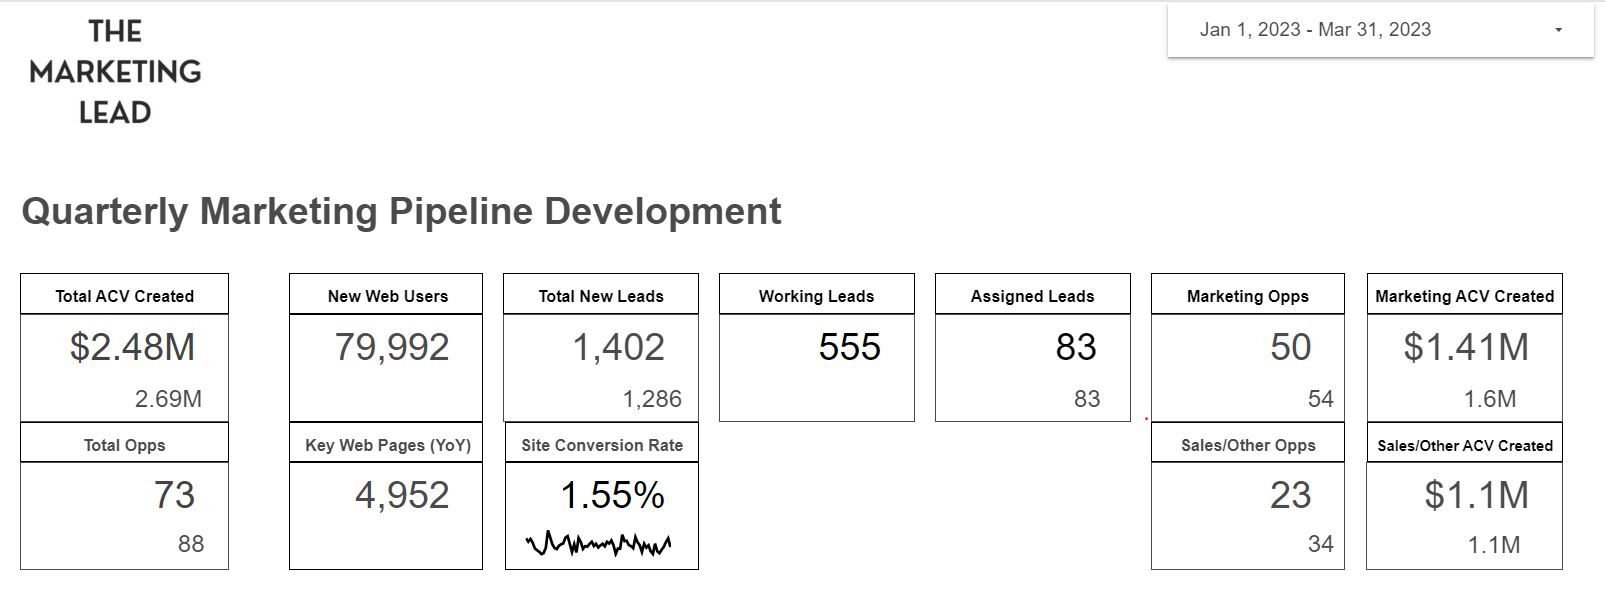
A dashboard should be something that shows you how you are performing, how you are trending, and where you are gapped to your target. When you can’t clearly see how your results compare relative to your targets at a daily, monthly, quarterly, and annual level, you don’t really know if you are on track or not.
This dashboard allows you to see your real-time results relative to your targets, and in a way that you can customize to your brand.
With a few quick data connections, you can take your Salesforce data and present it the way you want it.
Here’s how it works and what I will provide.
- Locate and save your Salesforce reports that you will require.
- Download the Data Connector add-on in Google Sheets. Search and find our Salesforce reports. (Upon purchase, I will share a video of this)
- Create a new Sheet with your targets (I will share how to do this as well and the Google Sheet template.
- Map your new Sheet data to the Data Studio/Looker Studio link provided when you purchase.


Reviews
There are no reviews yet.