Menu


Digital marketers love Google Looker Studio. It has become one of the most popular analytics reporting and dashboarding platforms in the digital marketing community. While Looker Studio is fairly easy to get started, it can still take significant time and resources to build state-of-the-art dashboards. This is where Looker Studio templates come into play.
Templates allow marketers to shortcut setup time, reduce cost and access expert community work. Our goal is to make this process as easy and smooth as possible by enabling you to find your ideal template. We’ve done the hard yards for you, by hand-picking our compilation of the best Looker Studio Templates for 2024
In our review, we have covered 5 different categories and included the top Looker Studio Templates available for each category. If you are searching for a great template, look no further.
Feel free to jump ahead to the category you are most interested in:
In this section, we present our favorite dashboards for lead generation websites. These are usually non-eCommerce templates. These templates are designed to allow website managers and digital marketers to understand how users are interacting with their websites and where problems may exist. They provide overview analysis on website performance, user flow, engagement rates, top visited pages etc… Many of these templates rely on Google Analytics 4 as it’s the most common analytics tracking tool. If you would like to dig deeper into GA4 dashboards, check out our dedicated article on the best Google Analytics 4 dashboards & reports here or view our full range of the latest GA4 templates here.
Easy
Agency & client-side reporting for all levels of management. Any non-eComm website that is running GA4 tracking.
Google Analytics 4
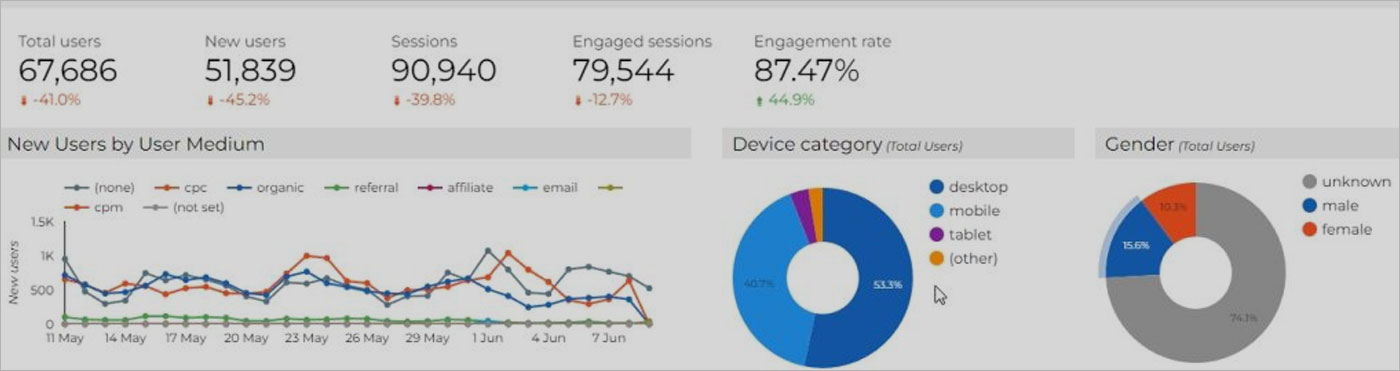
This 5-page report covers everything you need to understand your website metrics. It collects data about traffic sources, content and engagement.
The template does not boast a beautiful design and it also does not go into huge amounts of detail. However, it does try and keep things clear and simple and makes it easy to see an overview of your main engagement metrics. For this reason we think it is a great value for money template.
The template links easily to Google Analytics 4 property. This gives you a client-ready dashboard in minutes allowing you to spend your time analysing data and providing insights.
We like the simplicity of the report, even though it is 5 pages, it is easy enough to find insights. For those after a more in depth report, a similar 13 page version of the template can be found here.
– Unique & easy to understand presentation
– Easily brandable for your company
– Supports GA4 & BigQuery
– Higher price tag
Easy
Lead Gen & eCommerce websites
Google Analytics 4, Big Query
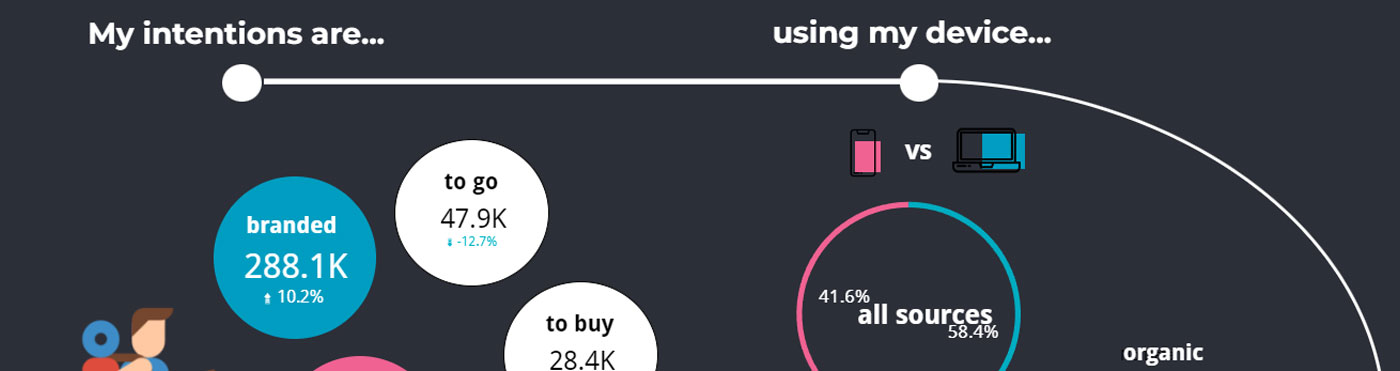
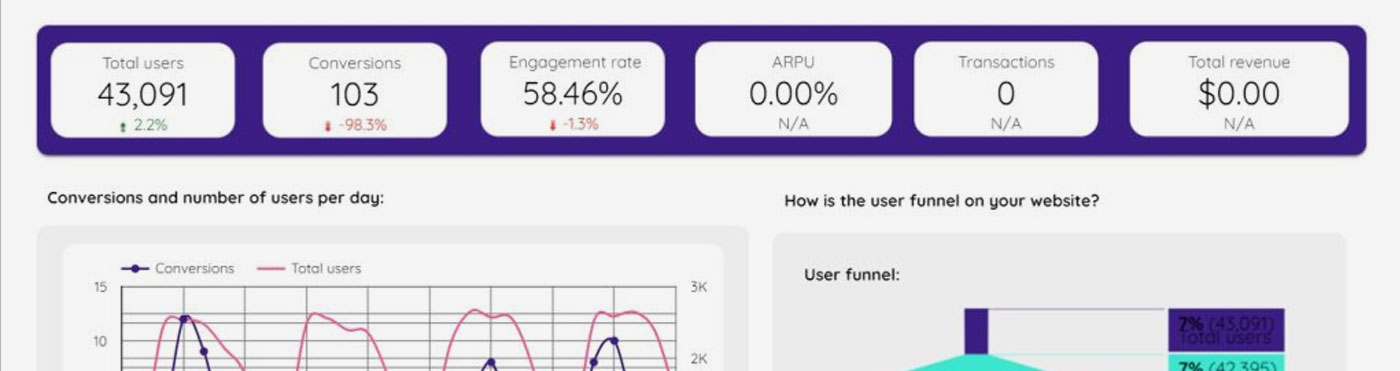
This is one of our favourite Looker Studio dashboards. The designer has taken the design to the next level and built the template around the data. This allows you to tell a visual story with your GA4 data.
The template is designed to help you explore your customer’s journey. You get the full picture of how customers interact with your site so you can address their pain points and remove obstacles.
The dashboard is easy to use and understand for users of all levels of expertise. And gives you data about page usage, geographic locations, device used, and source.
For those looking to easily pull insights from your GA4 data and present a story to stakeholders, this is the dashboard for you.
– Great for use on tablets, desktops & TV screens
– Touch screen friendly
– 27 Pages of data!
– Professional Design
Not setup for non-Google data sources (like Meta)
Easy
Google Analytics 4, Search Console, Google Ads, YouTube
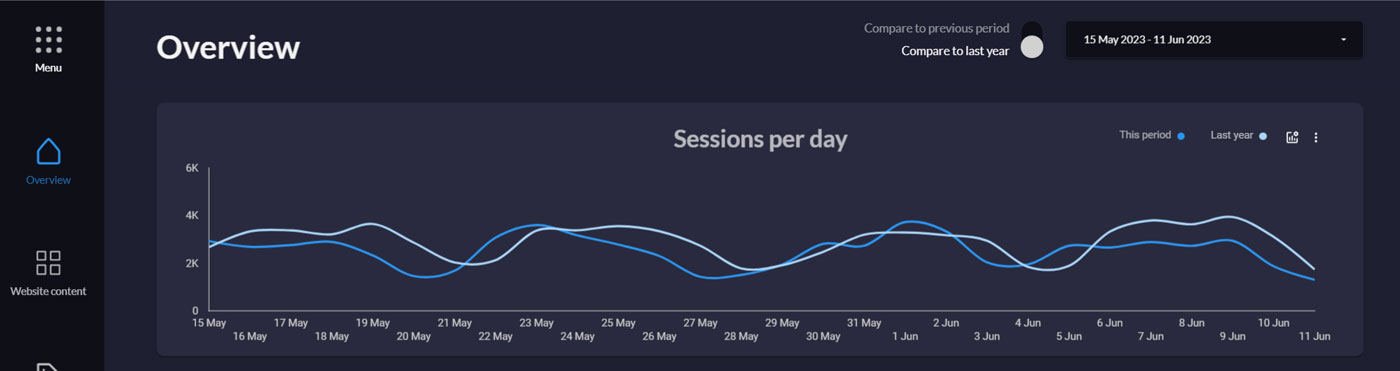
This full-screen dashboard is professionally designed and presents beautifully on desktops and tables.
With a modern, full-screen view, the template navigates like its own mini website. It’s perfect for a wall monitor, touch screen display, or presentation as it was created with a big screen in mind.
The layout helps you read the data clearly, and if you share the dashboard with others — like an agency partner or a project stakeholder — they’ll find it easy to navigate.
Besides just a great design, it’s also robust in the data it contains. You’ll be shocked at how much data it packs in. You’ll find website, ecommerce, ad, search, YouTube, goal completion data and more within the report.
The template connects easily to multiple data sources — Google Analytics 4, Search Console, Google Ads, and YouTube.
For those running an online store, transactions, revenue and conversion rates are the lifeblood of your business. We’ve found the best e-commerce focused templates and dashboards. These templates help you understand how users purchase, move through your funnel and interact with your website. For a more in-depth review of the best eCommerce templates available please review our in-depth eCommerce post: The Best eCommerce Data Studio Reports.
– Generate real-time infographics
– Impress stakeholders with creative visualizations
– Comes with instructions for set up.
– 3 seperate funnels provided
– Only for GA4 users (must have ecomm setup in GA4 first).
Easy
Google Analytics 4
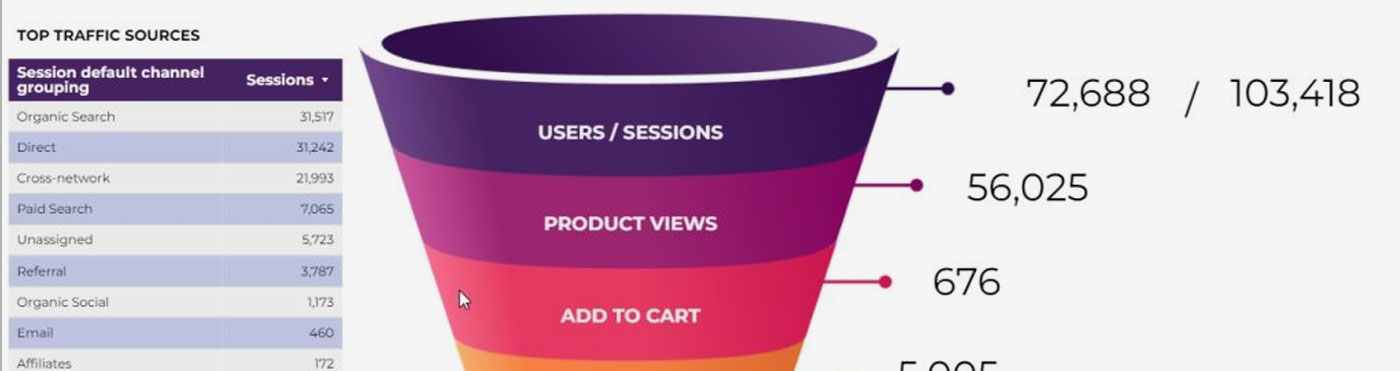
Infographics and visuals can make or break a presentation. For anyone who needs to impress stakeholders, this template is for you. Hook your Google Analytics up and this template will give you real-time infographics you can export as pdfs.
You can use them to represent your ecommerce funnel or user journey. The creative and easy-to-understand infographics include user and session data, product views, adds to cart, checkouts, and transactions.
With real-time updates, you no longer need to copy and paste numbers to your presentations or infographics — this template will do the hard work for you.
This template includes 3 pages, each with it’s own unique funnel visualization
– Made for Shopify Stores
– Massive dashboard with 17 pages
– Connect to: Sheets, Excel & other sources
– Instructions & support available
– You need to sign up to PMA to use it (free trial available)
Easy
Shopify stores that want comprehensive reporting outside of Shopify.
Shopify & Power My Analytics
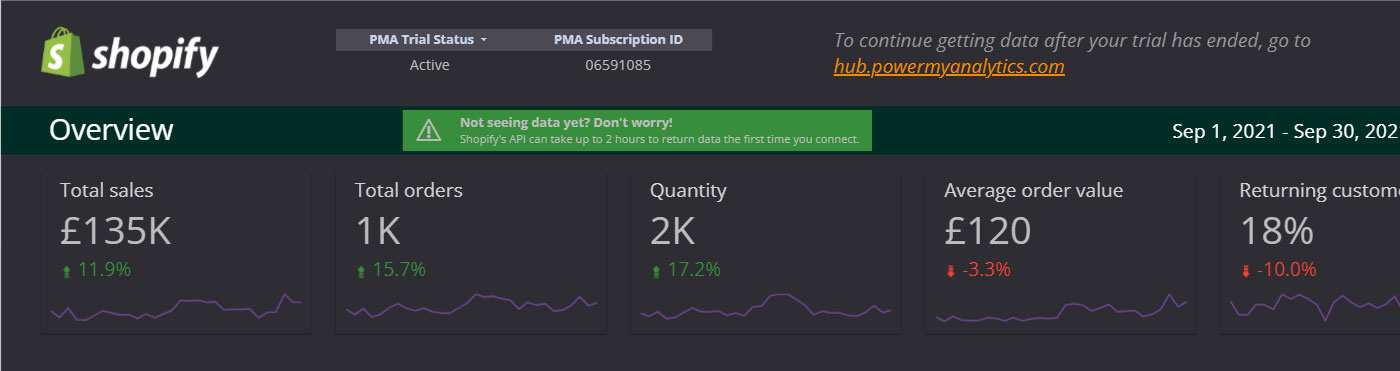
Designed for businesses who use Shopify to power their eCommerce, this template brings another dimension to reporting.
It enables Shopify businesses to present their data in a 3rd party Looker Studio Template. Reports can be shared outside of Looker Studio without having to provide access to Shopify
This template uses a ‘Power My Analytics’ data connector to link directly to a Shopify account and collect live data.
After an overview of the data on the first page, the template dives into specific sales data on each new page, breaking down data by product, date, vendor, variant, discount, location, customer, and more.
It’s one of the few good Shopify templates for Looker Studio we have found that do a good job covering all aspects of reporting.
Easy – about 5 minutes
E-commerce store managers & digital marketers looking to report on paid advertising traffic
GA4, Google Ads, Meta Ads, Pinterest Ads
Windsor.ai
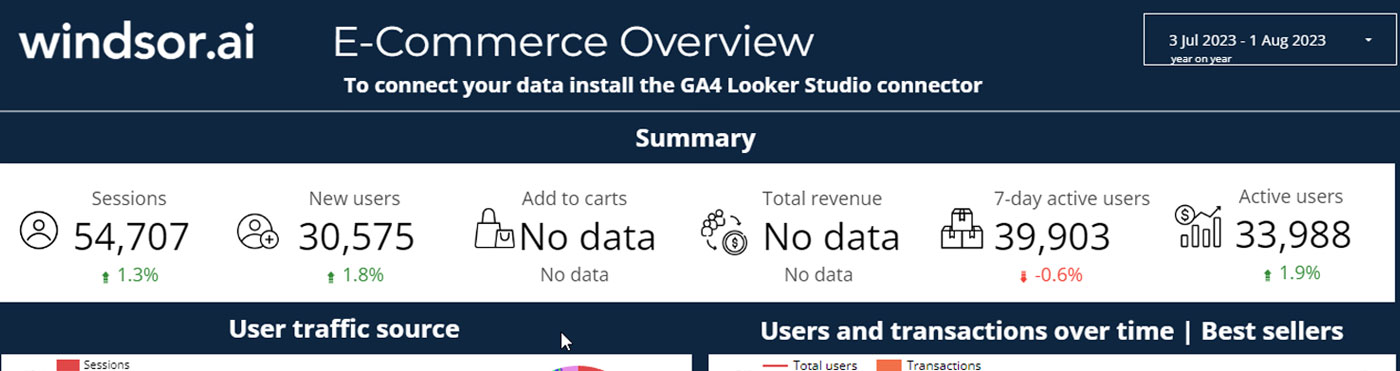
This e-commerce dashboard built for Google Looker Studio combines ease of set up with comprehensive reporting via Google Analytics 4 and paid advertising data sources including Meta, Google Ads and Pinterest.
The upside of this template is the combination of multiple data sources into a simple layout.
If you’re managing an e-commerce site and looking for a way to keep track of add-to-carts, revenue and site metrics then this report is for you.
The report itself is free to access, but does require Windsor.ai’s paid data connector which allows you to connect all data sources.
Although many analytics templates can be suitable for SEO reporting, we’ve created a section to highlight what we think are the best Looker Studio dashboards for SEO analysis. When it comes to SEO the main data sources are Google Search Console and GA4 integration. Other third party SEO tools can also be very useful. Below we’ve compiled our top SEO Looker Studio templates, if you want more great SEO templates check out our full article of the best SEO Dashboards for Looker Studio.
– Detailed report with easy navigation
– Slick-looking dark theme
– Eye popping graphs
– Excellent for SEO Analysis
– Only connects to 2 data sources (GA4 & Search Console). Does not include other traffic sources like GMB.
Easy
SEO Agencies and Consultants looking for a beautiful reporting dashboard
Google Analytics 4, Google Search Console
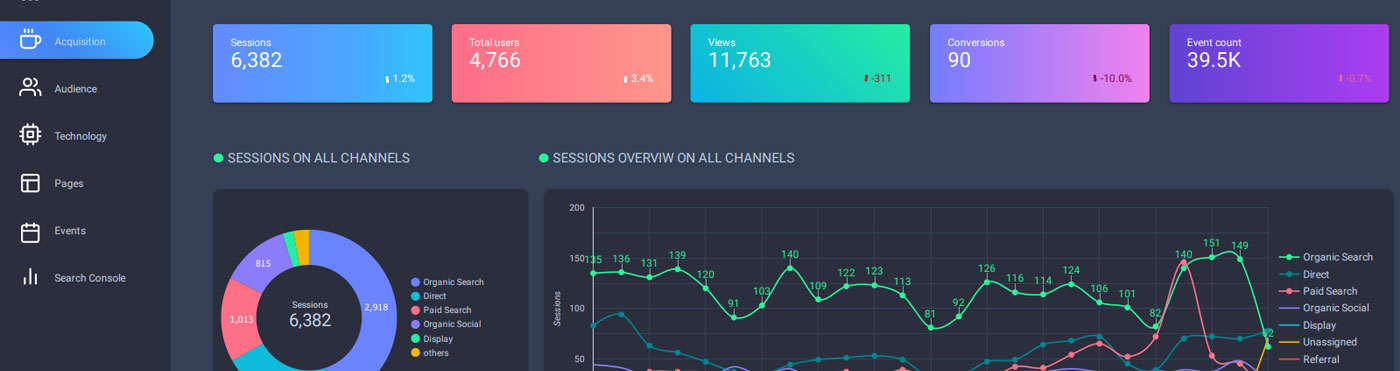
This a template that looks beautiful and is fun and easy to navigate. The pages are setup in the left column and allow you to jump from page to page without using the Looker Studio page drop downs.
The graphs themselves are intuitive and provide data popping insights through the use of vivid colours.
Although this template is focused on SEO traffic, this is a strong point of the template as it does not provide too much data. Rather just enough to make valuable insights and track website performance.
The dashboard includes a number of filtering options which are unique to each page.
We strongly recommend previewing this template as you will not be disappointed.
Easy
Local SEO, agencies and in-house, all size businesses with bricks and mortar shop
Google Analytics 4, Google Search Console, Google My Business Center
The nice thing about this report from Porter Metrics is it’s comprehensive perspective on SEO. With a page each for ecommerce, organic search traffic, analytics, and Google Business Profile, you get an integrated report that helps you see the big picture.
And all of this comes in a pretty package — the well-thought-out design makes this template clear and easy to see. The template packs a lot of data into 1 report, which can be helpful for some but may be overwhelming for others. Nevertheless it is a very valuable and comprehensive SEO all rounder report.
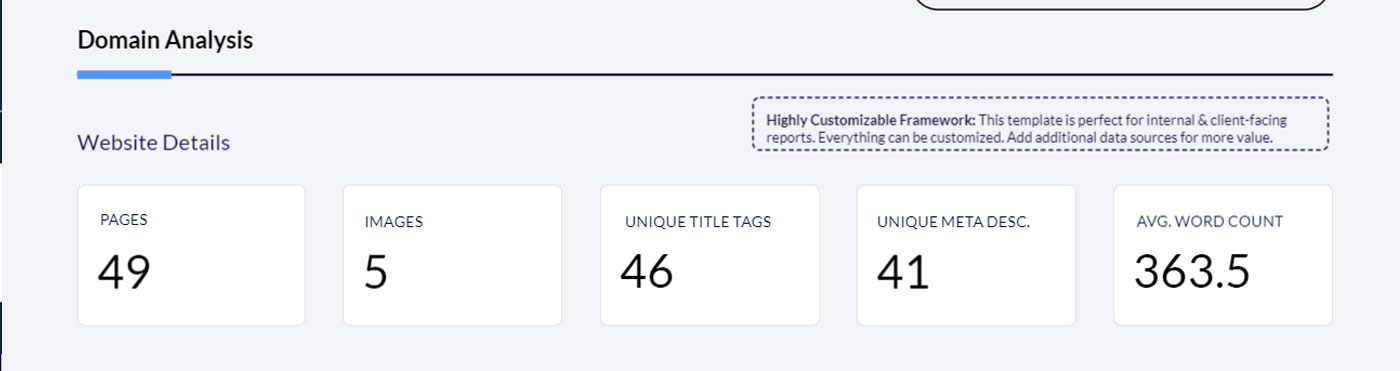
– Visualize crawl data for easy monthly reporting
– Excellent design and detailed set up instructions
– Hasn’t been tested with latest version of Screaming Frog so data may need some adjusting
Medium – Full instructions included!
Internal and client facing SEO reporting on technical site issues such as crawls, meta data, canonicals, etc.
Scraming Frog (via Google Sheets)
Screaming Frog is one of the best technical SEO tools available and part of the next generation of reporting templates. And their Screaming Frog Report Dashboard is one of the most popular reports available.
We love it because of its sophisticated customization ability. Once set up you can add your logo, change the conditional formatting, blend the crawl with your Google Analytics and change the elements included in reports.
Easy to use, this template is a game changer for SEO beginners and experts using a crawler boasting industry-leading analysis tools. The clean and crisp design allows you to use your SEO reporting for actionable decision making based on key insights and pattern detection.
The interactive dashboard is another popular aspect of this template, as it allows real-time data interaction during report meetings.
– Pull in all SEMRush data to one dashboard to view at a glance
– Share with clients who don’t have access to SEMRush
– FREE (but you will need an SEMrush account)
SEMRush has great internal graphs
Medium
SEO Consultants and website prospectors.
SEMRush
SEMRush
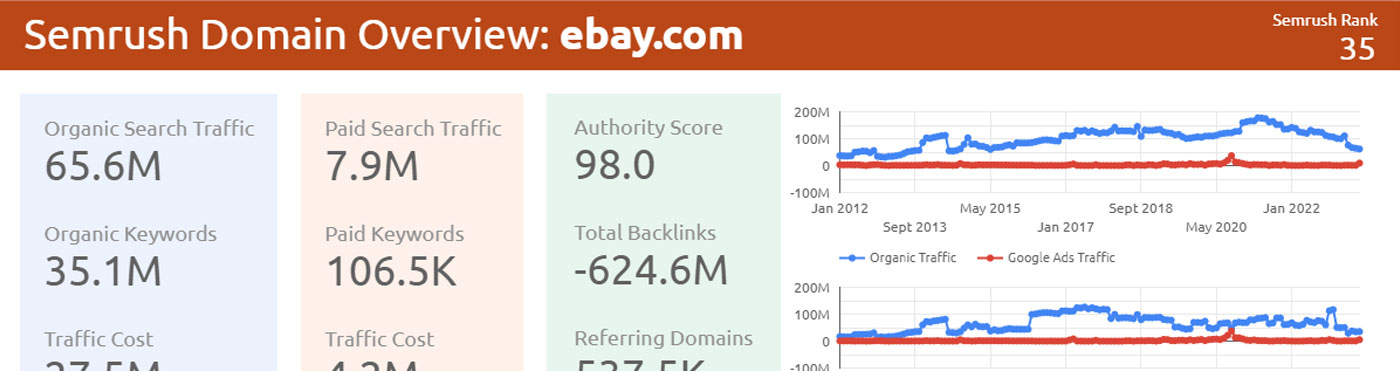
The SEMrush Domain Overview dashboard is perfect for displaying top level domain data to clients about their website or their competitor websites.
The report pulls in ranking metrics from SEMRush including traffic, keywords, and traffic cost split across organic and paid channels.
The template also shows your authority score, referring domains, and backlinks over time. Two tables show the top organic and paid keywords.
This report is built by SEMrush and is free to use. However you will need an SEMrush paid account to use it.
Marketing agencies have the difficult task of managing multiple clients. Looker Studio Templates can help you take advantage of economies of scale, thus making agency life a little bit easier. Monthly reporting can be a lot easier by utilizing a high quality Looker Studio dashboard, purchasing it once and rolling it out across a range of clients. The same is true for analysis and reporting. Below are some of our top picks for agencies that can help you solve some of these day to day challenges when running your agency:
– One of the most detailed Google Ads reports available
– Highly customizable with commentary sections for reporting
– Built with advertising agencies in mind – easy to rebrand and add notes.
Only made for Google Ads & Analytics reporting. Does not include other platforms, but these can be added.
Easy
Digital marketing agencies or freelancers with clients.
Google Ads, Google Analytics 4
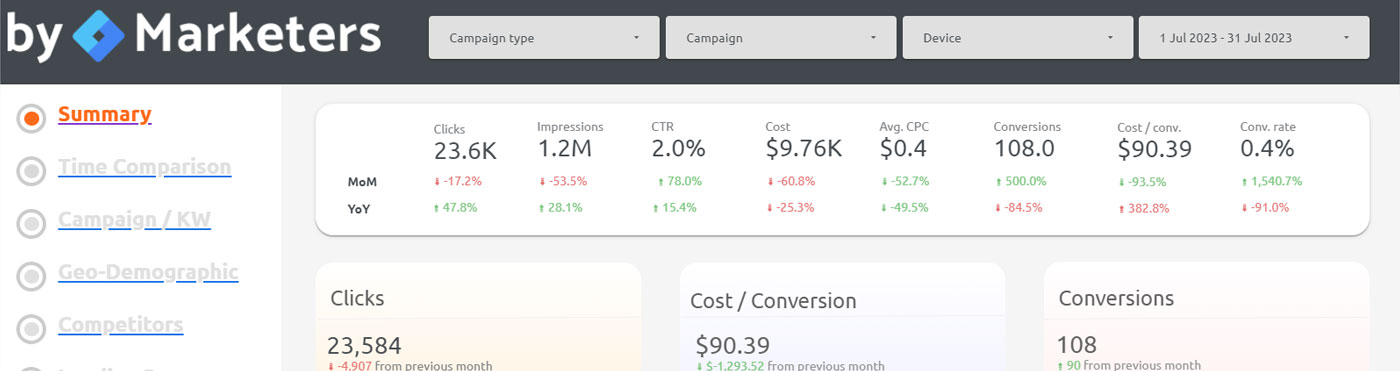
This report has been built with agencies in mind. That’s why we chose it for our top list. It is made for agencies who need to report back to their clients on all things Google Ads. In addition to the metrics on the template, the dashboard has placeholders for text so you can make notes about campaigns, strategy, and upcoming needs. There are also places for logos and other company identifiers to personalize the report.
The filters at the top of the template make it easy to navigate and isolate data specific to campaign types, campaigns, devices, and time frames.
Other pages on the template include time comparisons, campaigns and keywords, geographies and demographics, landing pages, and an analytics overview from data you’d find in Google Analytics.
One of our favorite charts is the competitor table which shows the domains, impression share, and overlap of your ad competitors.
If you’re an agency and have a number of clients this report is a no-brainer, it will save you lots of time and help you put impress your clients
– Comprehensive list of data sources all in one dashboard
– Clean design and client ready
– Easy to set up using Supermetrics
Requires monthly subscription to Supermetrics as a data connector which might not be ideal for everyone.
Easy
Digital Marketing agencies and specialists looking to report & analyse paid media activity.
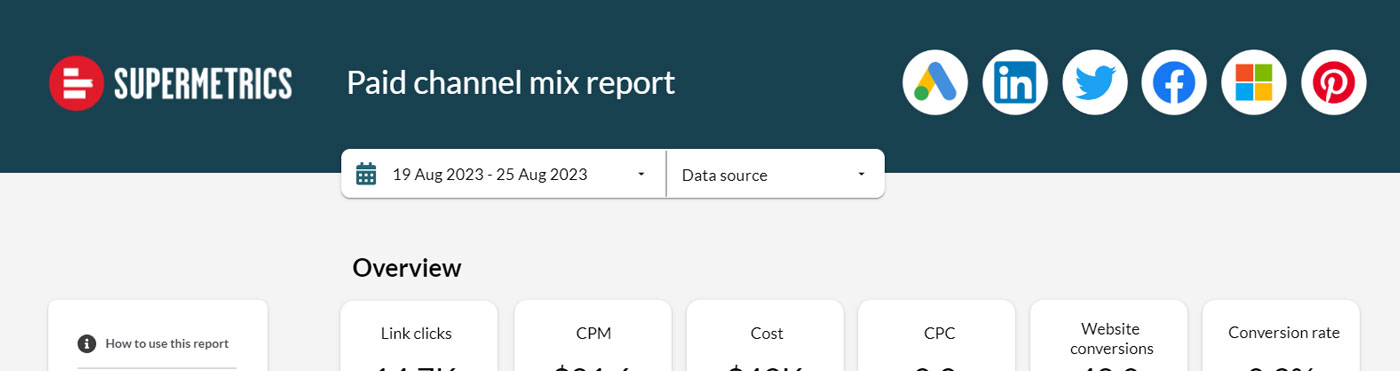
Meta, Google Ads, X (Twitter), Linkedin, Bing Ads & more.
It’s rare to have a dashboard that combines data from so many sources.
This template has been purpose built to compare data from multiple traffic sources. If you are a business running activing across marketing channels this template can be a great resource. Allowing you to compare and analyse the performance of these sources. The result is a single, consolidated view of all your paid digital advertising.
The template is created by Supermetrics and does require a paid subscription to use it. While this may put you off, think of the time saved of not having to log in to each seperate ad platform. Instead all of this data is automatically pulled into the dashboard and can be compared in one location.
Once you get the connectors set up (and it isn’t hard), you’ll have a live, fully comprehensive look at your paid marketing efforts. Use this link to get started on Supermetrics. And if you need more info about paid data connectors, check out this informative blog post.
– Combining 6 data sources
– Nice design and navigation
– Easy to set up using Porter Metrics
Requires subscription to run some of the data sources.
Easy
Agencies, analysts and website managers that derive traffic from multiple sources.
Google Ads, Google Analytics 4, Google Search Console, Linkedin, Meta, Youtube
Porter Metrics
This is one of the most comprehensive dashboards we have seen. It pulls in data from over 6 data sources.
It’s other strength is it’s design. It has been very well designed and also includes an easy to use navigation.
The template itself has a relatively high price tag compared with other templates featured in this article. However considering the time effort to built it and the scope of the template, we think it offers a lot of value.
Porter Metrics has also designed the template to be able to use any 3rd party connector, so you can decide which company to use to help integrate your data.
– Be able to track your personal finances in Looker Studio. Allows for real time tracking
– Customisable
Requires subscription to Tiller Money
Medium
Anyone interested in tracking their personal finance
Google Sheets & Tiller Money
With this template you can combine the power of Google Sheets, Tiller Money, and Google Data Studio to manage your personal finances. To use this you need to be registered with Tiller Money which you then need to link to Google Sheets.
In the template you can see your total balance across accounts, your latest transactions, and a comparison of income and expenses.
We have presented our top picks. What was your favorite? Have we missed any great templates out? If you’d like to give feedback or suggest other dashboards to add to the list, please feel free to contact us.
There is no difference. Google Looker Studio is the new name for what was previously Google Data Studio.
Google announced the name change in October 2022 as a rebranding for the free dashboard and data visualisation tool to bring it all under one business intelligence platform.
Google data studio is a free tool you can use to visualize your data. Just hook up a data connector and you can create fully customizable and shareable reports. Elements you can add include charts, tables, and maps. You can add filters and date ranges to make your report interactive. And you can design your own styles and color schemes.
Google Looker Studio is a great tool for people who want to visualize their data. The key advantages of Data Studio are:
1. It’s free to use.
2. The learning curve isn’t steep.
3. Integration with other Google products (like YouTube, Google Analytics or Google Ads) is easy.
4. There are hundreds of data connectors.
5. Easy to share and collaborate on with peers.
You should use Google Data Studio templates because you can get insights into your data without having to build and design it yourself. You save time and effort. But still get the benefits of Google Data Studio.